pandas_10minutes
Pandas 10분 완성
https://dataitgirls2.github.io/10minutes2pandas/
1 | # 라이브러리 불러오기 |
1.Object Creation (객체 생성)
- Pandas는 값을 가지고 있는 리스트를 통해 Series를 만들고, 정수로 만들어진 인덱스를 기본값으로 불러온다.
1 | # Series를 이용한 객체 생성 |
0    1.0
1    3.0
2    5.0
3    NaN
4    6.0
5    8.0
dtype: float64
- datetime 인덱스와 레이블이 있는 열을 가지고 있는 numpy 배열을 전달하여 데이터프레임을 만든다.
1 | # date_range()를 이용해 20130101을 포함한 연속적인 6일의 데이터를 넣는다. |
DatetimeIndex(['2013-01-01', '2013-01-02', '2013-01-03', '2013-01-04',
               '2013-01-05', '2013-01-06'],
              dtype='datetime64[ns]', freq='D')
1 | # 데이터 프레임 생성 |
| A | B | C | D | |
|---|---|---|---|---|
| 2013-01-01 | -0.214371 | -0.489334 | 0.807876 | -2.328570 |
| 2013-01-02 | -0.018762 | -0.438046 | 0.593880 | 0.671849 |
| 2013-01-03 | -0.596207 | 0.081615 | 0.182117 | -2.063007 |
| 2013-01-04 | -2.044753 | -0.853425 | 1.582471 | -0.756233 |
| 2013-01-05 | 0.394973 | -0.526762 | 0.393856 | 1.550660 |
| 2013-01-06 | -1.665879 | 0.184903 | 1.905710 | 2.345500 |
  <script>
    const buttonEl =
      document.querySelector('#df-98ec8384-9a3f-4ee3-9d62-d8f6d1821857 button.colab-df-convert');
    buttonEl.style.display =
      google.colab.kernel.accessAllowed ? 'block' : 'none';

    async function convertToInteractive(key) {
      const element = document.querySelector('#df-98ec8384-9a3f-4ee3-9d62-d8f6d1821857');
      const dataTable =
        await google.colab.kernel.invokeFunction('convertToInteractive',
                                                 [key], {});
      if (!dataTable) return;

      const docLinkHtml = 'Like what you see? Visit the ' +
        '<a target="_blank" href=https://colab.research.google.com/notebooks/data_table.ipynb>data table notebook</a>'
        + ' to learn more about interactive tables.';
      element.innerHTML = '';
      dataTable['output_type'] = 'display_data';
      await google.colab.output.renderOutput(dataTable, element);
      const docLink = document.createElement('div');
      docLink.innerHTML = docLinkHtml;
      element.appendChild(docLink);
    }
  </script>
</div>
- Series와 같은 것으로 변환될 수 있는 객체들의 dict로 구성된 데이터프레임을 만든다.
1 | df2 = pd.DataFrame({'A' : 1., |
| A | B | C | D | E | F | |
|---|---|---|---|---|---|---|
| 0 | 1.0 | 2013-01-02 | 1.0 | 3 | test | foo |
| 1 | 1.0 | 2013-01-02 | 1.0 | 3 | train | foo |
| 2 | 1.0 | 2013-01-02 | 1.0 | 3 | test | foo |
| 3 | 1.0 | 2013-01-02 | 1.0 | 3 | train | foo |
  <script>
    const buttonEl =
      document.querySelector('#df-32a9a2b4-301b-48af-8afa-569444b4838a button.colab-df-convert');
    buttonEl.style.display =
      google.colab.kernel.accessAllowed ? 'block' : 'none';

    async function convertToInteractive(key) {
      const element = document.querySelector('#df-32a9a2b4-301b-48af-8afa-569444b4838a');
      const dataTable =
        await google.colab.kernel.invokeFunction('convertToInteractive',
                                                 [key], {});
      if (!dataTable) return;

      const docLinkHtml = 'Like what you see? Visit the ' +
        '<a target="_blank" href=https://colab.research.google.com/notebooks/data_table.ipynb>data table notebook</a>'
        + ' to learn more about interactive tables.';
      element.innerHTML = '';
      dataTable['output_type'] = 'display_data';
      await google.colab.output.renderOutput(dataTable, element);
      const docLink = document.createElement('div');
      docLink.innerHTML = docLinkHtml;
      element.appendChild(docLink);
    }
  </script>
</div>
- 데이터프레임 결과물의 열은 다양한 데이터 타입 (dtypes) 으로 구성
1 | df2.dtypes |
A           float64
B    datetime64[ns]
C           float32
D             int32
E          category
F            object
dtype: object
2.Viewing Data (데이터 확인하기)
- 데이터프레임의 가장 윗 줄과 마지막 줄을 확인하고 싶을 때에 사용하는 방법은 다음과 같다.
1 | df.tail(3) # 끝에서부터 3줄을 출력 |
| A | B | C | D | |
|---|---|---|---|---|
| 2013-01-02 | -0.018762 | -0.438046 | 0.593880 | 0.671849 |
| 2013-01-03 | -0.596207 | 0.081615 | 0.182117 | -2.063007 |
| 2013-01-04 | -2.044753 | -0.853425 | 1.582471 | -0.756233 |
| 2013-01-05 | 0.394973 | -0.526762 | 0.393856 | 1.550660 |
| 2013-01-06 | -1.665879 | 0.184903 | 1.905710 | 2.345500 |
  <script>
    const buttonEl =
      document.querySelector('#df-b90adfec-6c56-41b4-a15c-699d26a51033 button.colab-df-convert');
    buttonEl.style.display =
      google.colab.kernel.accessAllowed ? 'block' : 'none';

    async function convertToInteractive(key) {
      const element = document.querySelector('#df-b90adfec-6c56-41b4-a15c-699d26a51033');
      const dataTable =
        await google.colab.kernel.invokeFunction('convertToInteractive',
                                                 [key], {});
      if (!dataTable) return;

      const docLinkHtml = 'Like what you see? Visit the ' +
        '<a target="_blank" href=https://colab.research.google.com/notebooks/data_table.ipynb>data table notebook</a>'
        + ' to learn more about interactive tables.';
      element.innerHTML = '';
      dataTable['output_type'] = 'display_data';
      await google.colab.output.renderOutput(dataTable, element);
      const docLink = document.createElement('div');
      docLink.innerHTML = docLinkHtml;
      element.appendChild(docLink);
    }
  </script>
</div>
1 | df.head() # 처음 5줄을 출력. |
| A | B | C | D | |
|---|---|---|---|---|
| 2013-01-01 | -0.214371 | -0.489334 | 0.807876 | -2.328570 |
| 2013-01-02 | -0.018762 | -0.438046 | 0.593880 | 0.671849 |
| 2013-01-03 | -0.596207 | 0.081615 | 0.182117 | -2.063007 |
| 2013-01-04 | -2.044753 | -0.853425 | 1.582471 | -0.756233 |
| 2013-01-05 | 0.394973 | -0.526762 | 0.393856 | 1.550660 |
  <script>
    const buttonEl =
      document.querySelector('#df-1d5aaccf-3123-46cc-a71a-b7f235656a2f button.colab-df-convert');
    buttonEl.style.display =
      google.colab.kernel.accessAllowed ? 'block' : 'none';

    async function convertToInteractive(key) {
      const element = document.querySelector('#df-1d5aaccf-3123-46cc-a71a-b7f235656a2f');
      const dataTable =
        await google.colab.kernel.invokeFunction('convertToInteractive',
                                                 [key], {});
      if (!dataTable) return;

      const docLinkHtml = 'Like what you see? Visit the ' +
        '<a target="_blank" href=https://colab.research.google.com/notebooks/data_table.ipynb>data table notebook</a>'
        + ' to learn more about interactive tables.';
      element.innerHTML = '';
      dataTable['output_type'] = 'display_data';
      await google.colab.output.renderOutput(dataTable, element);
      const docLink = document.createElement('div');
      docLink.innerHTML = docLinkHtml;
      element.appendChild(docLink);
    }
  </script>
</div>
- 인덱스(index), 열(column) 그리고 numpy 데이터에 대한 세부 정보를 표시
1 | df.index |
DatetimeIndex(['2013-01-01', '2013-01-02', '2013-01-03', '2013-01-04',
               '2013-01-05', '2013-01-06'],
              dtype='datetime64[ns]', freq='D')
1 | df.columns |
Index(['A', 'B', 'C', 'D'], dtype='object')
1 | df.values |
array([[-0.21437119, -0.48933404,  0.80787593, -2.32856993],
       [-0.01876194, -0.43804563,  0.59387975,  0.67184854],
       [-0.59620717,  0.08161493,  0.18211706, -2.06300731],
       [-2.0447528 , -0.85342539,  1.58247067, -0.75623263],
       [ 0.39497306, -0.52676189,  0.39385602,  1.55066002],
       [-1.66587853,  0.18490331,  1.9057098 ,  2.34549952]])
- describe()는 데이터의 대략적인 통계적 정보 요약을 보여준다.
1 | df.describe() |
| A | B | C | D | |
|---|---|---|---|---|
| count | 6.000000 | 6.000000 | 6.000000 | 6.000000 |
| mean | -0.690833 | -0.340175 | 0.910985 | -0.096634 |
| std | 0.964410 | 0.395899 | 0.685599 | 1.926208 |
| min | -2.044753 | -0.853425 | 0.182117 | -2.328570 |
| 25% | -1.398461 | -0.517405 | 0.443862 | -1.736314 |
| 50% | -0.405289 | -0.463690 | 0.700878 | -0.042192 |
| 75% | -0.067664 | -0.048300 | 1.388822 | 1.330957 |
| max | 0.394973 | 0.184903 | 1.905710 | 2.345500 |
  <script>
    const buttonEl =
      document.querySelector('#df-bc50d2c1-8824-4181-b8ce-c7aecf4a30e1 button.colab-df-convert');
    buttonEl.style.display =
      google.colab.kernel.accessAllowed ? 'block' : 'none';

    async function convertToInteractive(key) {
      const element = document.querySelector('#df-bc50d2c1-8824-4181-b8ce-c7aecf4a30e1');
      const dataTable =
        await google.colab.kernel.invokeFunction('convertToInteractive',
                                                 [key], {});
      if (!dataTable) return;

      const docLinkHtml = 'Like what you see? Visit the ' +
        '<a target="_blank" href=https://colab.research.google.com/notebooks/data_table.ipynb>data table notebook</a>'
        + ' to learn more about interactive tables.';
      element.innerHTML = '';
      dataTable['output_type'] = 'display_data';
      await google.colab.output.renderOutput(dataTable, element);
      const docLink = document.createElement('div');
      docLink.innerHTML = docLinkHtml;
      element.appendChild(docLink);
    }
  </script>
</div>
- 데이터를 전치한다.
- 즉, 두 축을 서로 바꾼다
1 | df.T |
| 2013-01-01 | 2013-01-02 | 2013-01-03 | 2013-01-04 | 2013-01-05 | 2013-01-06 | |
|---|---|---|---|---|---|---|
| A | -0.214371 | -0.018762 | -0.596207 | -2.044753 | 0.394973 | -1.665879 |
| B | -0.489334 | -0.438046 | 0.081615 | -0.853425 | -0.526762 | 0.184903 |
| C | 0.807876 | 0.593880 | 0.182117 | 1.582471 | 0.393856 | 1.905710 |
| D | -2.328570 | 0.671849 | -2.063007 | -0.756233 | 1.550660 | 2.345500 |
  <script>
    const buttonEl =
      document.querySelector('#df-cfc48a53-c108-4b41-bf62-f85fc6923d20 button.colab-df-convert');
    buttonEl.style.display =
      google.colab.kernel.accessAllowed ? 'block' : 'none';

    async function convertToInteractive(key) {
      const element = document.querySelector('#df-cfc48a53-c108-4b41-bf62-f85fc6923d20');
      const dataTable =
        await google.colab.kernel.invokeFunction('convertToInteractive',
                                                 [key], {});
      if (!dataTable) return;

      const docLinkHtml = 'Like what you see? Visit the ' +
        '<a target="_blank" href=https://colab.research.google.com/notebooks/data_table.ipynb>data table notebook</a>'
        + ' to learn more about interactive tables.';
      element.innerHTML = '';
      dataTable['output_type'] = 'display_data';
      await google.colab.output.renderOutput(dataTable, element);
      const docLink = document.createElement('div');
      docLink.innerHTML = docLinkHtml;
      element.appendChild(docLink);
    }
  </script>
</div>
- 축 별로 정렬한다.
1 | df.sort_index(axis=1, ascending=False) |
| D | C | B | A | |
|---|---|---|---|---|
| 2013-01-01 | -2.328570 | 0.807876 | -0.489334 | -0.214371 |
| 2013-01-02 | 0.671849 | 0.593880 | -0.438046 | -0.018762 |
| 2013-01-03 | -2.063007 | 0.182117 | 0.081615 | -0.596207 |
| 2013-01-04 | -0.756233 | 1.582471 | -0.853425 | -2.044753 |
| 2013-01-05 | 1.550660 | 0.393856 | -0.526762 | 0.394973 |
| 2013-01-06 | 2.345500 | 1.905710 | 0.184903 | -1.665879 |
  <script>
    const buttonEl =
      document.querySelector('#df-2b34e281-4cce-48fe-b140-c57dc7828ca4 button.colab-df-convert');
    buttonEl.style.display =
      google.colab.kernel.accessAllowed ? 'block' : 'none';

    async function convertToInteractive(key) {
      const element = document.querySelector('#df-2b34e281-4cce-48fe-b140-c57dc7828ca4');
      const dataTable =
        await google.colab.kernel.invokeFunction('convertToInteractive',
                                                 [key], {});
      if (!dataTable) return;

      const docLinkHtml = 'Like what you see? Visit the ' +
        '<a target="_blank" href=https://colab.research.google.com/notebooks/data_table.ipynb>data table notebook</a>'
        + ' to learn more about interactive tables.';
      element.innerHTML = '';
      dataTable['output_type'] = 'display_data';
      await google.colab.output.renderOutput(dataTable, element);
      const docLink = document.createElement('div');
      docLink.innerHTML = docLinkHtml;
      element.appendChild(docLink);
    }
  </script>
</div>
- 값 별로 정렬한다.
1 | df.sort_values(by='B') |
| A | B | C | D | |
|---|---|---|---|---|
| 2013-01-04 | -2.044753 | -0.853425 | 1.582471 | -0.756233 |
| 2013-01-05 | 0.394973 | -0.526762 | 0.393856 | 1.550660 |
| 2013-01-01 | -0.214371 | -0.489334 | 0.807876 | -2.328570 |
| 2013-01-02 | -0.018762 | -0.438046 | 0.593880 | 0.671849 |
| 2013-01-03 | -0.596207 | 0.081615 | 0.182117 | -2.063007 |
| 2013-01-06 | -1.665879 | 0.184903 | 1.905710 | 2.345500 |
  <script>
    const buttonEl =
      document.querySelector('#df-30e7da7b-4a36-43a6-b2c3-a5a382f252de button.colab-df-convert');
    buttonEl.style.display =
      google.colab.kernel.accessAllowed ? 'block' : 'none';

    async function convertToInteractive(key) {
      const element = document.querySelector('#df-30e7da7b-4a36-43a6-b2c3-a5a382f252de');
      const dataTable =
        await google.colab.kernel.invokeFunction('convertToInteractive',
                                                 [key], {});
      if (!dataTable) return;

      const docLinkHtml = 'Like what you see? Visit the ' +
        '<a target="_blank" href=https://colab.research.google.com/notebooks/data_table.ipynb>data table notebook</a>'
        + ' to learn more about interactive tables.';
      element.innerHTML = '';
      dataTable['output_type'] = 'display_data';
      await google.colab.output.renderOutput(dataTable, element);
      const docLink = document.createElement('div');
      docLink.innerHTML = docLinkHtml;
      element.appendChild(docLink);
    }
  </script>
</div>
3.Selection (선택)
주석 (Note) : 선택과 설정을 위한 Python / Numpy의 표준화된 표현들이 직관적이며, 코드 작성을 위한 양방향 작업에 유용하지만 우리는 Pandas에 최적화된 데이터 접근 방법인 .at, .iat, .loc 및 .iloc 을 추천.
Getting (데이터 얻기)
- df.A 와 동일한 Series를 생성하는 단일 열을 선택
1 | df['A'] |
2013-01-01   -0.214371
2013-01-02   -0.018762
2013-01-03   -0.596207
2013-01-04   -2.044753
2013-01-05    0.394973
2013-01-06   -1.665879
Freq: D, Name: A, dtype: float64
- 행을 분할하는 [ ]를 통해 선택한다.
1 | df[0:3] |
| A | B | C | D | |
|---|---|---|---|---|
| 2013-01-01 | 0.654753 | -0.366034 | -1.440226 | -1.043957 |
| 2013-01-02 | 1.589167 | 0.321939 | 1.393342 | 0.898153 |
| 2013-01-03 | 0.270879 | 0.107423 | -2.032053 | 1.861947 |
  <script>
    const buttonEl =
      document.querySelector('#df-42a08968-1f35-45a3-bca9-318f73f513c6 button.colab-df-convert');
    buttonEl.style.display =
      google.colab.kernel.accessAllowed ? 'block' : 'none';

    async function convertToInteractive(key) {
      const element = document.querySelector('#df-42a08968-1f35-45a3-bca9-318f73f513c6');
      const dataTable =
        await google.colab.kernel.invokeFunction('convertToInteractive',
                                                 [key], {});
      if (!dataTable) return;

      const docLinkHtml = 'Like what you see? Visit the ' +
        '<a target="_blank" href=https://colab.research.google.com/notebooks/data_table.ipynb>data table notebook</a>'
        + ' to learn more about interactive tables.';
      element.innerHTML = '';
      dataTable['output_type'] = 'display_data';
      await google.colab.output.renderOutput(dataTable, element);
      const docLink = document.createElement('div');
      docLink.innerHTML = docLinkHtml;
      element.appendChild(docLink);
    }
  </script>
</div>
1 | df['20130102':'20130104'] |
| A | B | C | D | |
|---|---|---|---|---|
| 2013-01-02 | -0.018762 | -0.438046 | 0.593880 | 0.671849 |
| 2013-01-03 | -0.596207 | 0.081615 | 0.182117 | -2.063007 |
| 2013-01-04 | -2.044753 | -0.853425 | 1.582471 | -0.756233 |
  <script>
    const buttonEl =
      document.querySelector('#df-ebb43e9b-1f8f-4438-93a1-e004bc46108e button.colab-df-convert');
    buttonEl.style.display =
      google.colab.kernel.accessAllowed ? 'block' : 'none';

    async function convertToInteractive(key) {
      const element = document.querySelector('#df-ebb43e9b-1f8f-4438-93a1-e004bc46108e');
      const dataTable =
        await google.colab.kernel.invokeFunction('convertToInteractive',
                                                 [key], {});
      if (!dataTable) return;

      const docLinkHtml = 'Like what you see? Visit the ' +
        '<a target="_blank" href=https://colab.research.google.com/notebooks/data_table.ipynb>data table notebook</a>'
        + ' to learn more about interactive tables.';
      element.innerHTML = '';
      dataTable['output_type'] = 'display_data';
      await google.colab.output.renderOutput(dataTable, element);
      const docLink = document.createElement('div');
      docLink.innerHTML = docLinkHtml;
      element.appendChild(docLink);
    }
  </script>
</div>
Selection by Label (Label을 통한 선택)
- 라벨을 사용하여 횡단면을 얻는다.
1 | df.loc[dates[0]] |
A   -0.214371
B   -0.489334
C    0.807876
D   -2.328570
Name: 2013-01-01 00:00:00, dtype: float64
- 라벨을 사용하여 여러 축의 데이터를 획득한다.
1 | df.loc[:,['A','B']] |
| A | B | |
|---|---|---|
| 2013-01-01 | -0.214371 | -0.489334 |
| 2013-01-02 | -0.018762 | -0.438046 |
| 2013-01-03 | -0.596207 | 0.081615 |
| 2013-01-04 | -2.044753 | -0.853425 |
| 2013-01-05 | 0.394973 | -0.526762 |
| 2013-01-06 | -1.665879 | 0.184903 |
  <script>
    const buttonEl =
      document.querySelector('#df-0d130634-6f70-4a3b-a931-3907cbf47eb6 button.colab-df-convert');
    buttonEl.style.display =
      google.colab.kernel.accessAllowed ? 'block' : 'none';

    async function convertToInteractive(key) {
      const element = document.querySelector('#df-0d130634-6f70-4a3b-a931-3907cbf47eb6');
      const dataTable =
        await google.colab.kernel.invokeFunction('convertToInteractive',
                                                 [key], {});
      if (!dataTable) return;

      const docLinkHtml = 'Like what you see? Visit the ' +
        '<a target="_blank" href=https://colab.research.google.com/notebooks/data_table.ipynb>data table notebook</a>'
        + ' to learn more about interactive tables.';
      element.innerHTML = '';
      dataTable['output_type'] = 'display_data';
      await google.colab.output.renderOutput(dataTable, element);
      const docLink = document.createElement('div');
      docLink.innerHTML = docLinkHtml;
      element.appendChild(docLink);
    }
  </script>
</div>
- 양쪽 종단점을 포함한 라벨 슬라이싱을 표시.
1 | df.loc['20130102':'20130104', ['A','B']] |
| A | B | |
|---|---|---|
| 2013-01-02 | -0.018762 | -0.438046 |
| 2013-01-03 | -0.596207 | 0.081615 |
| 2013-01-04 | -2.044753 | -0.853425 |
  <script>
    const buttonEl =
      document.querySelector('#df-80998ed9-78c8-48ef-84e6-b2e58d3420c3 button.colab-df-convert');
    buttonEl.style.display =
      google.colab.kernel.accessAllowed ? 'block' : 'none';

    async function convertToInteractive(key) {
      const element = document.querySelector('#df-80998ed9-78c8-48ef-84e6-b2e58d3420c3');
      const dataTable =
        await google.colab.kernel.invokeFunction('convertToInteractive',
                                                 [key], {});
      if (!dataTable) return;

      const docLinkHtml = 'Like what you see? Visit the ' +
        '<a target="_blank" href=https://colab.research.google.com/notebooks/data_table.ipynb>data table notebook</a>'
        + ' to learn more about interactive tables.';
      element.innerHTML = '';
      dataTable['output_type'] = 'display_data';
      await google.colab.output.renderOutput(dataTable, element);
      const docLink = document.createElement('div');
      docLink.innerHTML = docLinkHtml;
      element.appendChild(docLink);
    }
  </script>
</div>
- 반환되는 객체의 차원를 줄인다.
1 | df.loc['20130102',['A','B']] |
A   -0.018762
B   -0.438046
Name: 2013-01-02 00:00:00, dtype: float64
- 스칼라 값을 얻는다.
1 | df.loc[dates[0], 'A'] |
-0.21437119207750993
- 스칼라 값을 더 빠르게 구하는 방법 (앞선 메소드와 동일하다)
1 | df.at[dates[0], 'A'] |
-0.21437119207750993
Selection by Position(위치로 선택하기)
- 넘겨받은 정수의 위치를 기준으로 선택.
1 | df.iloc[3] |
A   -2.044753
B   -0.853425
C    1.582471
D   -0.756233
Name: 2013-01-04 00:00:00, dtype: float64
- 정수로 표기된 슬라이스들을 통해, numpy / python과 유사하게 작동.
1 | df.iloc[3:5, 0:2] |
| A | B | |
|---|---|---|
| 2013-01-04 | -2.044753 | -0.853425 |
| 2013-01-05 | 0.394973 | -0.526762 |
  <script>
    const buttonEl =
      document.querySelector('#df-a6c9e7cd-47c2-42bc-8726-b9b8dbf72bb9 button.colab-df-convert');
    buttonEl.style.display =
      google.colab.kernel.accessAllowed ? 'block' : 'none';

    async function convertToInteractive(key) {
      const element = document.querySelector('#df-a6c9e7cd-47c2-42bc-8726-b9b8dbf72bb9');
      const dataTable =
        await google.colab.kernel.invokeFunction('convertToInteractive',
                                                 [key], {});
      if (!dataTable) return;

      const docLinkHtml = 'Like what you see? Visit the ' +
        '<a target="_blank" href=https://colab.research.google.com/notebooks/data_table.ipynb>data table notebook</a>'
        + ' to learn more about interactive tables.';
      element.innerHTML = '';
      dataTable['output_type'] = 'display_data';
      await google.colab.output.renderOutput(dataTable, element);
      const docLink = document.createElement('div');
      docLink.innerHTML = docLinkHtml;
      element.appendChild(docLink);
    }
  </script>
</div>
- 정수로 표기된 위치값의 리스트를 통하여 numpy / python 의 스타일과 유사해진다.
1 | df.iloc[[1, 2, 4], [0, 2]] |
| A | C | |
|---|---|---|
| 2013-01-02 | -0.018762 | 0.593880 |
| 2013-01-03 | -0.596207 | 0.182117 |
| 2013-01-05 | 0.394973 | 0.393856 |
  <script>
    const buttonEl =
      document.querySelector('#df-1d8279d9-f642-48e7-8d6a-5006bade95b3 button.colab-df-convert');
    buttonEl.style.display =
      google.colab.kernel.accessAllowed ? 'block' : 'none';

    async function convertToInteractive(key) {
      const element = document.querySelector('#df-1d8279d9-f642-48e7-8d6a-5006bade95b3');
      const dataTable =
        await google.colab.kernel.invokeFunction('convertToInteractive',
                                                 [key], {});
      if (!dataTable) return;

      const docLinkHtml = 'Like what you see? Visit the ' +
        '<a target="_blank" href=https://colab.research.google.com/notebooks/data_table.ipynb>data table notebook</a>'
        + ' to learn more about interactive tables.';
      element.innerHTML = '';
      dataTable['output_type'] = 'display_data';
      await google.colab.output.renderOutput(dataTable, element);
      const docLink = document.createElement('div');
      docLink.innerHTML = docLinkHtml;
      element.appendChild(docLink);
    }
  </script>
</div>
- 다음은 명시적으로 행을 나누고자 하는 경우이다
- 즉, 한쪽을 공백으로 둘 경우
1 | df.iloc[1:3, : ] |
| A | B | C | D | |
|---|---|---|---|---|
| 2013-01-02 | -0.018762 | -0.438046 | 0.593880 | 0.671849 |
| 2013-01-03 | -0.596207 | 0.081615 | 0.182117 | -2.063007 |
  <script>
    const buttonEl =
      document.querySelector('#df-f8cec5e2-bbc6-4151-9e24-a55e5e4cd2b8 button.colab-df-convert');
    buttonEl.style.display =
      google.colab.kernel.accessAllowed ? 'block' : 'none';

    async function convertToInteractive(key) {
      const element = document.querySelector('#df-f8cec5e2-bbc6-4151-9e24-a55e5e4cd2b8');
      const dataTable =
        await google.colab.kernel.invokeFunction('convertToInteractive',
                                                 [key], {});
      if (!dataTable) return;

      const docLinkHtml = 'Like what you see? Visit the ' +
        '<a target="_blank" href=https://colab.research.google.com/notebooks/data_table.ipynb>data table notebook</a>'
        + ' to learn more about interactive tables.';
      element.innerHTML = '';
      dataTable['output_type'] = 'display_data';
      await google.colab.output.renderOutput(dataTable, element);
      const docLink = document.createElement('div');
      docLink.innerHTML = docLinkHtml;
      element.appendChild(docLink);
    }
  </script>
</div>
- 다음은 명시적으로 열을 나누고자 하는 경우이다
- 즉, 한쪽을 공백으로 둘 경우
1 | df.iloc[ : , 1:3] |
| B | C | |
|---|---|---|
| 2013-01-01 | -0.489334 | 0.807876 |
| 2013-01-02 | -0.438046 | 0.593880 |
| 2013-01-03 | 0.081615 | 0.182117 |
| 2013-01-04 | -0.853425 | 1.582471 |
| 2013-01-05 | -0.526762 | 0.393856 |
| 2013-01-06 | 0.184903 | 1.905710 |
  <script>
    const buttonEl =
      document.querySelector('#df-e2e93a02-91f2-43f7-a503-bec4339b83b8 button.colab-df-convert');
    buttonEl.style.display =
      google.colab.kernel.accessAllowed ? 'block' : 'none';

    async function convertToInteractive(key) {
      const element = document.querySelector('#df-e2e93a02-91f2-43f7-a503-bec4339b83b8');
      const dataTable =
        await google.colab.kernel.invokeFunction('convertToInteractive',
                                                 [key], {});
      if (!dataTable) return;

      const docLinkHtml = 'Like what you see? Visit the ' +
        '<a target="_blank" href=https://colab.research.google.com/notebooks/data_table.ipynb>data table notebook</a>'
        + ' to learn more about interactive tables.';
      element.innerHTML = '';
      dataTable['output_type'] = 'display_data';
      await google.colab.output.renderOutput(dataTable, element);
      const docLink = document.createElement('div');
      docLink.innerHTML = docLinkHtml;
      element.appendChild(docLink);
    }
  </script>
</div>
- 다음은 명시적으로 (특정한) 값을 얻고자 하는 경우이다.
1 | df.iloc[1, 1] |
-0.43804562902186034
- 스칼라 값을 빠르게 얻는 방법 (위의 방식과 동일하다)
1 | df.iat[1,1] |
-0.43804562902186034
Boolean Indexing
- 데이터를 선택하기 위해 단일 열의 값을 사용
1 | df[df.A > 0] |
| A | B | C | D | |
|---|---|---|---|---|
| 2013-01-05 | 0.394973 | -0.526762 | 0.393856 | 1.55066 |
  <script>
    const buttonEl =
      document.querySelector('#df-4f4aed32-1929-4051-a6c9-8f593fb92c84 button.colab-df-convert');
    buttonEl.style.display =
      google.colab.kernel.accessAllowed ? 'block' : 'none';

    async function convertToInteractive(key) {
      const element = document.querySelector('#df-4f4aed32-1929-4051-a6c9-8f593fb92c84');
      const dataTable =
        await google.colab.kernel.invokeFunction('convertToInteractive',
                                                 [key], {});
      if (!dataTable) return;

      const docLinkHtml = 'Like what you see? Visit the ' +
        '<a target="_blank" href=https://colab.research.google.com/notebooks/data_table.ipynb>data table notebook</a>'
        + ' to learn more about interactive tables.';
      element.innerHTML = '';
      dataTable['output_type'] = 'display_data';
      await google.colab.output.renderOutput(dataTable, element);
      const docLink = document.createElement('div');
      docLink.innerHTML = docLinkHtml;
      element.appendChild(docLink);
    }
  </script>
</div>
- Boolean 조건을 충족하는 데이터프레임에서 값을 선택
1 | df[df > 0] |
| A | B | C | D | |
|---|---|---|---|---|
| 2013-01-01 | NaN | NaN | 0.807876 | NaN |
| 2013-01-02 | NaN | NaN | 0.593880 | 0.671849 |
| 2013-01-03 | NaN | 0.081615 | 0.182117 | NaN |
| 2013-01-04 | NaN | NaN | 1.582471 | NaN |
| 2013-01-05 | 0.394973 | NaN | 0.393856 | 1.550660 |
| 2013-01-06 | NaN | 0.184903 | 1.905710 | 2.345500 |
  <script>
    const buttonEl =
      document.querySelector('#df-35a1e446-5c1c-4a6c-b39d-6ff2b7801761 button.colab-df-convert');
    buttonEl.style.display =
      google.colab.kernel.accessAllowed ? 'block' : 'none';

    async function convertToInteractive(key) {
      const element = document.querySelector('#df-35a1e446-5c1c-4a6c-b39d-6ff2b7801761');
      const dataTable =
        await google.colab.kernel.invokeFunction('convertToInteractive',
                                                 [key], {});
      if (!dataTable) return;

      const docLinkHtml = 'Like what you see? Visit the ' +
        '<a target="_blank" href=https://colab.research.google.com/notebooks/data_table.ipynb>data table notebook</a>'
        + ' to learn more about interactive tables.';
      element.innerHTML = '';
      dataTable['output_type'] = 'display_data';
      await google.colab.output.renderOutput(dataTable, element);
      const docLink = document.createElement('div');
      docLink.innerHTML = docLinkHtml;
      element.appendChild(docLink);
    }
  </script>
</div>
isin
- 필터링을 위한 메소드이다.
1 | df2 = df.copy() |
1 | # df2[df2['E'].isin(['two','four'])] |
Setting (설정)
- 새 열을 설정하면 데이터가 인덱스 별로 자동 정렬된다.
1 | s1 = pd.Series([1,2,3,4,5,6], index=pd.date_range('20130102', periods=6)) |
2013-01-02    1
2013-01-03    2
2013-01-04    3
2013-01-05    4
2013-01-06    5
2013-01-07    6
Freq: D, dtype: int64
1 | df['F'] = s1 |
- 라벨에 의해 값을 설정한다.
1 | df.at[dates[0], 'A'] = 0 |
- 위치에 의해 값을 설정한다.
1 | df.iat[0, 1] = 0 |
- Numpy 배열을 사용한 할당에 의해 값을 설정한다.
1 | df.loc[:, 'D'] = np.array([5] * len(df)) |
- 위 설정대로 작동한 결과다.
1 | df |
| A | B | C | D | F | |
|---|---|---|---|---|---|
| 2013-01-01 | 0.000000 | 0.000000 | 0.807876 | 5 | NaN |
| 2013-01-02 | -0.018762 | -0.438046 | 0.593880 | 5 | 1.0 |
| 2013-01-03 | -0.596207 | 0.081615 | 0.182117 | 5 | 2.0 |
| 2013-01-04 | -2.044753 | -0.853425 | 1.582471 | 5 | 3.0 |
| 2013-01-05 | 0.394973 | -0.526762 | 0.393856 | 5 | 4.0 |
| 2013-01-06 | -1.665879 | 0.184903 | 1.905710 | 5 | 5.0 |
  <script>
    const buttonEl =
      document.querySelector('#df-12bdced2-022e-4cec-87a4-12165a361bd7 button.colab-df-convert');
    buttonEl.style.display =
      google.colab.kernel.accessAllowed ? 'block' : 'none';

    async function convertToInteractive(key) {
      const element = document.querySelector('#df-12bdced2-022e-4cec-87a4-12165a361bd7');
      const dataTable =
        await google.colab.kernel.invokeFunction('convertToInteractive',
                                                 [key], {});
      if (!dataTable) return;

      const docLinkHtml = 'Like what you see? Visit the ' +
        '<a target="_blank" href=https://colab.research.google.com/notebooks/data_table.ipynb>data table notebook</a>'
        + ' to learn more about interactive tables.';
      element.innerHTML = '';
      dataTable['output_type'] = 'display_data';
      await google.colab.output.renderOutput(dataTable, element);
      const docLink = document.createElement('div');
      docLink.innerHTML = docLinkHtml;
      element.appendChild(docLink);
    }
  </script>
</div>
- where 연산을 설정합니다.
1 | df2 = df.copy() |
| A | B | C | D | F | |
|---|---|---|---|---|---|
| 2013-01-01 | 0.000000 | 0.000000 | -0.807876 | -5 | NaN |
| 2013-01-02 | -0.018762 | -0.438046 | -0.593880 | -5 | -1.0 |
| 2013-01-03 | -0.596207 | -0.081615 | -0.182117 | -5 | -2.0 |
| 2013-01-04 | -2.044753 | -0.853425 | -1.582471 | -5 | -3.0 |
| 2013-01-05 | -0.394973 | -0.526762 | -0.393856 | -5 | -4.0 |
| 2013-01-06 | -1.665879 | -0.184903 | -1.905710 | -5 | -5.0 |
  <script>
    const buttonEl =
      document.querySelector('#df-2e3a7cd9-4958-46ba-a9ca-9fb4031816c0 button.colab-df-convert');
    buttonEl.style.display =
      google.colab.kernel.accessAllowed ? 'block' : 'none';

    async function convertToInteractive(key) {
      const element = document.querySelector('#df-2e3a7cd9-4958-46ba-a9ca-9fb4031816c0');
      const dataTable =
        await google.colab.kernel.invokeFunction('convertToInteractive',
                                                 [key], {});
      if (!dataTable) return;

      const docLinkHtml = 'Like what you see? Visit the ' +
        '<a target="_blank" href=https://colab.research.google.com/notebooks/data_table.ipynb>data table notebook</a>'
        + ' to learn more about interactive tables.';
      element.innerHTML = '';
      dataTable['output_type'] = 'display_data';
      await google.colab.output.renderOutput(dataTable, element);
      const docLink = document.createElement('div');
      docLink.innerHTML = docLinkHtml;
      element.appendChild(docLink);
    }
  </script>
</div>
4.Missing Data (결측치)
- Pandas는 결측치를 표현하기 위해 주로 np.nan 값을 사용한다.
- 이 방법은 기본 설정값이지만 계산에는 포함되지 않는다.
- Reindexing으로 지정된 축 상의 인덱스를 변경 / 추가 / 삭제 가능. Reindexing은 데이터의 복사본을 반환.
1 | df1 = df.reindex(index=dates[0:4], columns=list(df.columns) + ['E']) |
| A | B | C | D | F | E | |
|---|---|---|---|---|---|---|
| 2013-01-01 | 0.000000 | 0.000000 | 0.807876 | 5 | NaN | 1.0 |
| 2013-01-02 | -0.018762 | -0.438046 | 0.593880 | 5 | 1.0 | 1.0 |
| 2013-01-03 | -0.596207 | 0.081615 | 0.182117 | 5 | 2.0 | NaN |
| 2013-01-04 | -2.044753 | -0.853425 | 1.582471 | 5 | 3.0 | NaN |
  <script>
    const buttonEl =
      document.querySelector('#df-bd5a580c-316a-44a4-b5af-496ed1ad2f48 button.colab-df-convert');
    buttonEl.style.display =
      google.colab.kernel.accessAllowed ? 'block' : 'none';

    async function convertToInteractive(key) {
      const element = document.querySelector('#df-bd5a580c-316a-44a4-b5af-496ed1ad2f48');
      const dataTable =
        await google.colab.kernel.invokeFunction('convertToInteractive',
                                                 [key], {});
      if (!dataTable) return;

      const docLinkHtml = 'Like what you see? Visit the ' +
        '<a target="_blank" href=https://colab.research.google.com/notebooks/data_table.ipynb>data table notebook</a>'
        + ' to learn more about interactive tables.';
      element.innerHTML = '';
      dataTable['output_type'] = 'display_data';
      await google.colab.output.renderOutput(dataTable, element);
      const docLink = document.createElement('div');
      docLink.innerHTML = docLinkHtml;
      element.appendChild(docLink);
    }
  </script>
</div>
- 결측치를 가지고 있는 행들을 지운다.
1 | df1.dropna(how = 'any') |
| A | B | C | D | F | E | |
|---|---|---|---|---|---|---|
| 2013-01-02 | -0.018762 | -0.438046 | 0.59388 | 5 | 1.0 | 1.0 |
  <script>
    const buttonEl =
      document.querySelector('#df-e2491041-b1d4-4902-9dce-0ef94792d204 button.colab-df-convert');
    buttonEl.style.display =
      google.colab.kernel.accessAllowed ? 'block' : 'none';

    async function convertToInteractive(key) {
      const element = document.querySelector('#df-e2491041-b1d4-4902-9dce-0ef94792d204');
      const dataTable =
        await google.colab.kernel.invokeFunction('convertToInteractive',
                                                 [key], {});
      if (!dataTable) return;

      const docLinkHtml = 'Like what you see? Visit the ' +
        '<a target="_blank" href=https://colab.research.google.com/notebooks/data_table.ipynb>data table notebook</a>'
        + ' to learn more about interactive tables.';
      element.innerHTML = '';
      dataTable['output_type'] = 'display_data';
      await google.colab.output.renderOutput(dataTable, element);
      const docLink = document.createElement('div');
      docLink.innerHTML = docLinkHtml;
      element.appendChild(docLink);
    }
  </script>
</div>
- 결측치를 채워 넣는다.
1 | df1.fillna(value=5) |
| A | B | C | D | F | E | |
|---|---|---|---|---|---|---|
| 2013-01-01 | 0.000000 | 0.000000 | 0.807876 | 5 | 5.0 | 1.0 |
| 2013-01-02 | -0.018762 | -0.438046 | 0.593880 | 5 | 1.0 | 1.0 |
| 2013-01-03 | -0.596207 | 0.081615 | 0.182117 | 5 | 2.0 | 5.0 |
| 2013-01-04 | -2.044753 | -0.853425 | 1.582471 | 5 | 3.0 | 5.0 |
  <script>
    const buttonEl =
      document.querySelector('#df-d9ef038f-e4ba-4702-b903-2a4056ec371e button.colab-df-convert');
    buttonEl.style.display =
      google.colab.kernel.accessAllowed ? 'block' : 'none';

    async function convertToInteractive(key) {
      const element = document.querySelector('#df-d9ef038f-e4ba-4702-b903-2a4056ec371e');
      const dataTable =
        await google.colab.kernel.invokeFunction('convertToInteractive',
                                                 [key], {});
      if (!dataTable) return;

      const docLinkHtml = 'Like what you see? Visit the ' +
        '<a target="_blank" href=https://colab.research.google.com/notebooks/data_table.ipynb>data table notebook</a>'
        + ' to learn more about interactive tables.';
      element.innerHTML = '';
      dataTable['output_type'] = 'display_data';
      await google.colab.output.renderOutput(dataTable, element);
      const docLink = document.createElement('div');
      docLink.innerHTML = docLinkHtml;
      element.appendChild(docLink);
    }
  </script>
</div>
- nan인 값에 boolean을 통한 표식을 얻는다.
- 데이터프레임의 모든 값이 boolean 형태로 표시되며, nan 값에만 True를 표시한다.
1 | pd.isna(df1) |
| A | B | C | D | F | E | |
|---|---|---|---|---|---|---|
| 2013-01-01 | False | False | False | False | True | False |
| 2013-01-02 | False | False | False | False | False | False |
| 2013-01-03 | False | False | False | False | False | True |
| 2013-01-04 | False | False | False | False | False | True |
  <script>
    const buttonEl =
      document.querySelector('#df-5ac60ecc-0098-4e10-8e23-74a0aa20e121 button.colab-df-convert');
    buttonEl.style.display =
      google.colab.kernel.accessAllowed ? 'block' : 'none';

    async function convertToInteractive(key) {
      const element = document.querySelector('#df-5ac60ecc-0098-4e10-8e23-74a0aa20e121');
      const dataTable =
        await google.colab.kernel.invokeFunction('convertToInteractive',
                                                 [key], {});
      if (!dataTable) return;

      const docLinkHtml = 'Like what you see? Visit the ' +
        '<a target="_blank" href=https://colab.research.google.com/notebooks/data_table.ipynb>data table notebook</a>'
        + ' to learn more about interactive tables.';
      element.innerHTML = '';
      dataTable['output_type'] = 'display_data';
      await google.colab.output.renderOutput(dataTable, element);
      const docLink = document.createElement('div');
      docLink.innerHTML = docLinkHtml;
      element.appendChild(docLink);
    }
  </script>
</div>
5.Operation (연산)
Stats (통계)
- 일반적으로 결측치를 제외한 후 연산.
- 기술통계를 수행한다.
1 | df.mean() |
A   -0.655105
B   -0.258619
C    0.910985
D    5.000000
F    3.000000
dtype: float64
- 다른 축에서도 동일한 연산을 수행.
1 | df.mean(1) |
2013-01-01    1.451969
2013-01-02    1.227414
2013-01-03    1.333505
2013-01-04    1.336858
2013-01-05    1.852413
2013-01-06    2.084947
Freq: D, dtype: float64
- 정렬이 필요하다. 차원이 다른 객체로 연산해보자.
- pandas는 지정된 차원을 따라 자동으로 브로드 캐스팅된다.
- broadcast란 n차원이나 스칼라 값으로 연산을 수행할 때 도출되는 결과의 규칙을 설명하는 것을 의미
1 | s = pd.Series([1, 3, 4, np.nan, 6, 8], index=dates) |
2013-01-01    1.0
2013-01-02    3.0
2013-01-03    4.0
2013-01-04    NaN
2013-01-05    6.0
2013-01-06    8.0
Freq: D, dtype: float64
- 위 코드를 shift로 2칸 옮긴 것
1 | s = pd.Series([1, 3, 4, np.nan, 6, 8], index=dates).shift(2) |
2013-01-01    NaN
2013-01-02    NaN
2013-01-03    1.0
2013-01-04    3.0
2013-01-05    4.0
2013-01-06    NaN
Freq: D, dtype: float64
- index를 축(axis)으로 실행
1 | df.sub(s, axis='index') |
| A | B | C | D | F | |
|---|---|---|---|---|---|
| 2013-01-01 | NaN | NaN | NaN | NaN | NaN |
| 2013-01-02 | NaN | NaN | NaN | NaN | NaN |
| 2013-01-03 | -1.596207 | -0.918385 | -0.817883 | 4.0 | 1.0 |
| 2013-01-04 | -5.044753 | -3.853425 | -1.417529 | 2.0 | 0.0 |
| 2013-01-05 | -3.605027 | -4.526762 | -3.606144 | 1.0 | 0.0 |
| 2013-01-06 | NaN | NaN | NaN | NaN | NaN |
  <script>
    const buttonEl =
      document.querySelector('#df-99b442a2-cd95-4ff7-886d-18b60cfb80eb button.colab-df-convert');
    buttonEl.style.display =
      google.colab.kernel.accessAllowed ? 'block' : 'none';

    async function convertToInteractive(key) {
      const element = document.querySelector('#df-99b442a2-cd95-4ff7-886d-18b60cfb80eb');
      const dataTable =
        await google.colab.kernel.invokeFunction('convertToInteractive',
                                                 [key], {});
      if (!dataTable) return;

      const docLinkHtml = 'Like what you see? Visit the ' +
        '<a target="_blank" href=https://colab.research.google.com/notebooks/data_table.ipynb>data table notebook</a>'
        + ' to learn more about interactive tables.';
      element.innerHTML = '';
      dataTable['output_type'] = 'display_data';
      await google.colab.output.renderOutput(dataTable, element);
      const docLink = document.createElement('div');
      docLink.innerHTML = docLinkHtml;
      element.appendChild(docLink);
    }
  </script>
</div>
Apply (적용)
- 데이터에 함수를 적용한다.
1 | df.apply(np.cumsum) |
| A | B | C | D | F | |
|---|---|---|---|---|---|
| 2013-01-01 | 0.000000 | 0.000000 | 0.807876 | 5 | NaN |
| 2013-01-02 | -0.018762 | -0.438046 | 1.401756 | 10 | 1.0 |
| 2013-01-03 | -0.614969 | -0.356431 | 1.583873 | 15 | 3.0 |
| 2013-01-04 | -2.659722 | -1.209856 | 3.166343 | 20 | 6.0 |
| 2013-01-05 | -2.264749 | -1.736618 | 3.560199 | 25 | 10.0 |
| 2013-01-06 | -3.930627 | -1.551715 | 5.465909 | 30 | 15.0 |
  <script>
    const buttonEl =
      document.querySelector('#df-5f71bb31-515e-4d3e-b14d-f49a6239f43b button.colab-df-convert');
    buttonEl.style.display =
      google.colab.kernel.accessAllowed ? 'block' : 'none';

    async function convertToInteractive(key) {
      const element = document.querySelector('#df-5f71bb31-515e-4d3e-b14d-f49a6239f43b');
      const dataTable =
        await google.colab.kernel.invokeFunction('convertToInteractive',
                                                 [key], {});
      if (!dataTable) return;

      const docLinkHtml = 'Like what you see? Visit the ' +
        '<a target="_blank" href=https://colab.research.google.com/notebooks/data_table.ipynb>data table notebook</a>'
        + ' to learn more about interactive tables.';
      element.innerHTML = '';
      dataTable['output_type'] = 'display_data';
      await google.colab.output.renderOutput(dataTable, element);
      const docLink = document.createElement('div');
      docLink.innerHTML = docLinkHtml;
      element.appendChild(docLink);
    }
  </script>
</div>
1 | df.apply(lambda x: x.max() - x.min()) |
A    2.439726
B    1.038329
C    1.723593
D    0.000000
F    4.000000
dtype: float64
Histogramming (히스토그래밍)
1 | s = pd.Series(np.random.randint(0, 7, size=10)) # 랜덤 생성 |
0    1
1    5
2    0
3    1
4    6
5    6
6    5
7    5
8    5
9    1
dtype: int64
1 | s.value_counts() |
5    4
1    3
6    2
0    1
dtype: int64
String Methods (문자열 메소드)
- Series는 다음의 코드와 같이 문자열 처리 메소드 모음 (set)을 가지고 있다.
- 이 모음은 배열의 각 요소를 쉽게 조작할 수 있도록 만들어주는 문자열의 속성에 포함되어 있다.
- 문자열의 패턴 일치 확인은 기본적으로 정규 표현식을 사용.
1 | s = pd.Series(['A', 'B', 'C', 'Aaba', 'Baca', np.nan, 'CABA', 'dog', 'cat']) |
0       a
1       b
2       c
3    aaba
4    baca
5     NaN
6    caba
7     dog
8     cat
dtype: object
6.Merge (병합)
concat (연결)
결합 (join) / 병합 (merge) 형태의 연산에 대한 인덱스, 관계 대수 기능을 위한 다양한 형태의 논리를 포함한 Series, 데이터프레임, Panel 객체를 손쉽게 결합할 수 있도록 하는 다양한 기능을 pandas 에서 제공한다.
concat()으로 pandas 객체를 연결한다.
1 | df = pd.DataFrame(np.random.randn(10, 4)) |
| 0 | 1 | 2 | 3 | |
|---|---|---|---|---|
| 0 | -0.639128 | -0.371715 | -2.320589 | 0.932025 |
| 1 | -1.041656 | 0.646479 | 1.551379 | -0.353387 |
| 2 | -0.782444 | 0.677232 | -0.050054 | -0.054370 |
| 3 | -0.418260 | 0.673768 | -1.694420 | 0.193668 |
| 4 | 0.788359 | -0.308937 | -0.314680 | -0.058661 |
| 5 | 0.457466 | -2.021977 | 0.611340 | -0.538168 |
| 6 | 1.355963 | 1.295236 | -0.399497 | -0.052334 |
| 7 | -0.324138 | -0.165932 | 0.290442 | 0.531520 |
| 8 | -0.386876 | 0.217569 | 0.926404 | -0.813724 |
| 9 | -0.452338 | -0.259533 | -0.810046 | 1.186298 |
  <script>
    const buttonEl =
      document.querySelector('#df-64ce2183-4d4b-4538-857b-4b2f38748c8b button.colab-df-convert');
    buttonEl.style.display =
      google.colab.kernel.accessAllowed ? 'block' : 'none';

    async function convertToInteractive(key) {
      const element = document.querySelector('#df-64ce2183-4d4b-4538-857b-4b2f38748c8b');
      const dataTable =
        await google.colab.kernel.invokeFunction('convertToInteractive',
                                                 [key], {});
      if (!dataTable) return;

      const docLinkHtml = 'Like what you see? Visit the ' +
        '<a target="_blank" href=https://colab.research.google.com/notebooks/data_table.ipynb>data table notebook</a>'
        + ' to learn more about interactive tables.';
      element.innerHTML = '';
      dataTable['output_type'] = 'display_data';
      await google.colab.output.renderOutput(dataTable, element);
      const docLink = document.createElement('div');
      docLink.innerHTML = docLinkHtml;
      element.appendChild(docLink);
    }
  </script>
</div>
1 | # break it into pieces |
| 0 | 1 | 2 | 3 | |
|---|---|---|---|---|
| 0 | -0.639128 | -0.371715 | -2.320589 | 0.932025 |
| 1 | -1.041656 | 0.646479 | 1.551379 | -0.353387 |
| 2 | -0.782444 | 0.677232 | -0.050054 | -0.054370 |
| 3 | -0.418260 | 0.673768 | -1.694420 | 0.193668 |
| 4 | 0.788359 | -0.308937 | -0.314680 | -0.058661 |
| 5 | 0.457466 | -2.021977 | 0.611340 | -0.538168 |
| 6 | 1.355963 | 1.295236 | -0.399497 | -0.052334 |
| 7 | -0.324138 | -0.165932 | 0.290442 | 0.531520 |
| 8 | -0.386876 | 0.217569 | 0.926404 | -0.813724 |
| 9 | -0.452338 | -0.259533 | -0.810046 | 1.186298 |
  <script>
    const buttonEl =
      document.querySelector('#df-b9f8c250-4e6a-49c3-8b57-729bd58c514f button.colab-df-convert');
    buttonEl.style.display =
      google.colab.kernel.accessAllowed ? 'block' : 'none';

    async function convertToInteractive(key) {
      const element = document.querySelector('#df-b9f8c250-4e6a-49c3-8b57-729bd58c514f');
      const dataTable =
        await google.colab.kernel.invokeFunction('convertToInteractive',
                                                 [key], {});
      if (!dataTable) return;

      const docLinkHtml = 'Like what you see? Visit the ' +
        '<a target="_blank" href=https://colab.research.google.com/notebooks/data_table.ipynb>data table notebook</a>'
        + ' to learn more about interactive tables.';
      element.innerHTML = '';
      dataTable['output_type'] = 'display_data';
      await google.colab.output.renderOutput(dataTable, element);
      const docLink = document.createElement('div');
      docLink.innerHTML = docLinkHtml;
      element.appendChild(docLink);
    }
  </script>
</div>
Join (결합)
SQL 방식으로 병합한다.
1 | left = pd.DataFrame({'key' : ['foo', 'foo'], 'lval' : [1, 2]}) |
| key | lval | |
|---|---|---|
| 0 | foo | 1 |
| 1 | foo | 2 |
  <script>
    const buttonEl =
      document.querySelector('#df-5ee0033f-5dc0-4ee1-a4ae-aab4984c9f56 button.colab-df-convert');
    buttonEl.style.display =
      google.colab.kernel.accessAllowed ? 'block' : 'none';

    async function convertToInteractive(key) {
      const element = document.querySelector('#df-5ee0033f-5dc0-4ee1-a4ae-aab4984c9f56');
      const dataTable =
        await google.colab.kernel.invokeFunction('convertToInteractive',
                                                 [key], {});
      if (!dataTable) return;

      const docLinkHtml = 'Like what you see? Visit the ' +
        '<a target="_blank" href=https://colab.research.google.com/notebooks/data_table.ipynb>data table notebook</a>'
        + ' to learn more about interactive tables.';
      element.innerHTML = '';
      dataTable['output_type'] = 'display_data';
      await google.colab.output.renderOutput(dataTable, element);
      const docLink = document.createElement('div');
      docLink.innerHTML = docLinkHtml;
      element.appendChild(docLink);
    }
  </script>
</div>
1 | right |
| key | rval | |
|---|---|---|
| 0 | foo | 4 |
| 1 | foo | 5 |
  <script>
    const buttonEl =
      document.querySelector('#df-7b2e03cd-9c2d-471a-aba2-b4a36968ffa5 button.colab-df-convert');
    buttonEl.style.display =
      google.colab.kernel.accessAllowed ? 'block' : 'none';

    async function convertToInteractive(key) {
      const element = document.querySelector('#df-7b2e03cd-9c2d-471a-aba2-b4a36968ffa5');
      const dataTable =
        await google.colab.kernel.invokeFunction('convertToInteractive',
                                                 [key], {});
      if (!dataTable) return;

      const docLinkHtml = 'Like what you see? Visit the ' +
        '<a target="_blank" href=https://colab.research.google.com/notebooks/data_table.ipynb>data table notebook</a>'
        + ' to learn more about interactive tables.';
      element.innerHTML = '';
      dataTable['output_type'] = 'display_data';
      await google.colab.output.renderOutput(dataTable, element);
      const docLink = document.createElement('div');
      docLink.innerHTML = docLinkHtml;
      element.appendChild(docLink);
    }
  </script>
</div>
- 위 두 가지를 병합하기
1 | pd.merge(left, right, on = 'key') |
| key | lval | rval | |
|---|---|---|---|
| 0 | foo | 1 | 4 |
| 1 | foo | 1 | 5 |
| 2 | foo | 2 | 4 |
| 3 | foo | 2 | 5 |
  <script>
    const buttonEl =
      document.querySelector('#df-62da57e4-df6e-4fe9-b5a0-3094a8ba0ed2 button.colab-df-convert');
    buttonEl.style.display =
      google.colab.kernel.accessAllowed ? 'block' : 'none';

    async function convertToInteractive(key) {
      const element = document.querySelector('#df-62da57e4-df6e-4fe9-b5a0-3094a8ba0ed2');
      const dataTable =
        await google.colab.kernel.invokeFunction('convertToInteractive',
                                                 [key], {});
      if (!dataTable) return;

      const docLinkHtml = 'Like what you see? Visit the ' +
        '<a target="_blank" href=https://colab.research.google.com/notebooks/data_table.ipynb>data table notebook</a>'
        + ' to learn more about interactive tables.';
      element.innerHTML = '';
      dataTable['output_type'] = 'display_data';
      await google.colab.output.renderOutput(dataTable, element);
      const docLink = document.createElement('div');
      docLink.innerHTML = docLinkHtml;
      element.appendChild(docLink);
    }
  </script>
</div>
Append (추가)
- 데이터프레임에 행을 추가한다.
1 | df = pd.DataFrame(np.random.randn(8, 4), columns=['A', 'B', 'C', 'D']) |
| A | B | C | D | |
|---|---|---|---|---|
| 0 | -0.909696 | 0.146335 | -0.568276 | -0.434510 |
| 1 | -0.802681 | 0.235747 | -0.751299 | -0.053560 |
| 2 | 2.005541 | -1.265754 | -1.152046 | -0.081151 |
| 3 | -0.422940 | -0.095189 | -1.634583 | 0.180732 |
| 4 | -1.535375 | -0.594391 | -1.102247 | 0.047852 |
| 5 | 0.369960 | -0.902356 | -1.196501 | -0.109521 |
| 6 | -1.369044 | -2.044557 | -0.487275 | 0.267463 |
| 7 | 0.439153 | 0.003023 | -1.716505 | -2.119485 |
  <script>
    const buttonEl =
      document.querySelector('#df-fb76804e-7023-4762-a17b-9f4e79e4d070 button.colab-df-convert');
    buttonEl.style.display =
      google.colab.kernel.accessAllowed ? 'block' : 'none';

    async function convertToInteractive(key) {
      const element = document.querySelector('#df-fb76804e-7023-4762-a17b-9f4e79e4d070');
      const dataTable =
        await google.colab.kernel.invokeFunction('convertToInteractive',
                                                 [key], {});
      if (!dataTable) return;

      const docLinkHtml = 'Like what you see? Visit the ' +
        '<a target="_blank" href=https://colab.research.google.com/notebooks/data_table.ipynb>data table notebook</a>'
        + ' to learn more about interactive tables.';
      element.innerHTML = '';
      dataTable['output_type'] = 'display_data';
      await google.colab.output.renderOutput(dataTable, element);
      const docLink = document.createElement('div');
      docLink.innerHTML = docLinkHtml;
      element.appendChild(docLink);
    }
  </script>
</div>
- 3행의 내용을 복사하여 8행을 추가한다.
1 | s = df.iloc[3] |
| A | B | C | D | |
|---|---|---|---|---|
| 0 | -0.909696 | 0.146335 | -0.568276 | -0.434510 |
| 1 | -0.802681 | 0.235747 | -0.751299 | -0.053560 |
| 2 | 2.005541 | -1.265754 | -1.152046 | -0.081151 |
| 3 | -0.422940 | -0.095189 | -1.634583 | 0.180732 |
| 4 | -1.535375 | -0.594391 | -1.102247 | 0.047852 |
| 5 | 0.369960 | -0.902356 | -1.196501 | -0.109521 |
| 6 | -1.369044 | -2.044557 | -0.487275 | 0.267463 |
| 7 | 0.439153 | 0.003023 | -1.716505 | -2.119485 |
| 8 | -0.422940 | -0.095189 | -1.634583 | 0.180732 |
  <script>
    const buttonEl =
      document.querySelector('#df-9c5c9e98-661f-4d00-b16c-b0e389424ef0 button.colab-df-convert');
    buttonEl.style.display =
      google.colab.kernel.accessAllowed ? 'block' : 'none';

    async function convertToInteractive(key) {
      const element = document.querySelector('#df-9c5c9e98-661f-4d00-b16c-b0e389424ef0');
      const dataTable =
        await google.colab.kernel.invokeFunction('convertToInteractive',
                                                 [key], {});
      if (!dataTable) return;

      const docLinkHtml = 'Like what you see? Visit the ' +
        '<a target="_blank" href=https://colab.research.google.com/notebooks/data_table.ipynb>data table notebook</a>'
        + ' to learn more about interactive tables.';
      element.innerHTML = '';
      dataTable['output_type'] = 'display_data';
      await google.colab.output.renderOutput(dataTable, element);
      const docLink = document.createElement('div');
      docLink.innerHTML = docLinkHtml;
      element.appendChild(docLink);
    }
  </script>
</div>
7.Grouping (그룹화)
- 룹화는 다음 단계 중 하나 이상을 포함하는 과정을 가리킨다.
- 몇몇 기준에 따라 여러 그룹으로 데이터를 분할 (splitting)
- 각 그룹에 독립적으로 함수를 적용 (applying)
- 결과물들을 하나의 데이터 구조로 결합 (combining)
1 | df = pd.DataFrame( |
| A | B | C | D | |
|---|---|---|---|---|
| 0 | foo | one | 0.144726 | 0.653074 |
| 1 | bar | one | -0.590503 | 0.128616 |
| 2 | foo | two | 1.816665 | -1.533646 |
| 3 | bar | three | -1.574489 | -0.140956 |
| 4 | foo | two | 0.103910 | 1.448011 |
| 5 | bar | two | -0.610817 | 0.742873 |
| 6 | foo | one | -1.576850 | 0.444138 |
| 7 | foo | three | 0.857080 | 0.157513 |
  <script>
    const buttonEl =
      document.querySelector('#df-eb85beec-778a-44c7-aac7-eb71caf64586 button.colab-df-convert');
    buttonEl.style.display =
      google.colab.kernel.accessAllowed ? 'block' : 'none';

    async function convertToInteractive(key) {
      const element = document.querySelector('#df-eb85beec-778a-44c7-aac7-eb71caf64586');
      const dataTable =
        await google.colab.kernel.invokeFunction('convertToInteractive',
                                                 [key], {});
      if (!dataTable) return;

      const docLinkHtml = 'Like what you see? Visit the ' +
        '<a target="_blank" href=https://colab.research.google.com/notebooks/data_table.ipynb>data table notebook</a>'
        + ' to learn more about interactive tables.';
      element.innerHTML = '';
      dataTable['output_type'] = 'display_data';
      await google.colab.output.renderOutput(dataTable, element);
      const docLink = document.createElement('div');
      docLink.innerHTML = docLinkHtml;
      element.appendChild(docLink);
    }
  </script>
</div>
- 생성된 데이터프레임을 그룹화한 후 각 그룹에 sum() 함수를 적용.
1 | df.groupby('A').sum() |
| C | D | |
|---|---|---|
| A | ||
| bar | -2.775808 | 0.730534 |
| foo | 1.345531 | 1.169089 |
  <script>
    const buttonEl =
      document.querySelector('#df-1aa22f34-79db-46e3-ae05-1187c99d6af5 button.colab-df-convert');
    buttonEl.style.display =
      google.colab.kernel.accessAllowed ? 'block' : 'none';

    async function convertToInteractive(key) {
      const element = document.querySelector('#df-1aa22f34-79db-46e3-ae05-1187c99d6af5');
      const dataTable =
        await google.colab.kernel.invokeFunction('convertToInteractive',
                                                 [key], {});
      if (!dataTable) return;

      const docLinkHtml = 'Like what you see? Visit the ' +
        '<a target="_blank" href=https://colab.research.google.com/notebooks/data_table.ipynb>data table notebook</a>'
        + ' to learn more about interactive tables.';
      element.innerHTML = '';
      dataTable['output_type'] = 'display_data';
      await google.colab.output.renderOutput(dataTable, element);
      const docLink = document.createElement('div');
      docLink.innerHTML = docLinkHtml;
      element.appendChild(docLink);
    }
  </script>
</div>
- 여러 열을 기준으로 그룹화하면 계층적 인덱스가 형성된다. 여기에도 sum 함수를 적용 가능.
1 | df.groupby(['A', 'B']).sum() |
| C | D | ||
|---|---|---|---|
| A | B | ||
| bar | one | -0.590503 | 0.128616 |
| three | -1.574489 | -0.140956 | |
| two | -0.610817 | 0.742873 | |
| foo | one | -1.432124 | 1.097212 |
| three | 0.857080 | 0.157513 | |
| two | 1.920575 | -0.085635 |
  <script>
    const buttonEl =
      document.querySelector('#df-4d41ac7d-2fef-4b0e-a140-e235f321dab0 button.colab-df-convert');
    buttonEl.style.display =
      google.colab.kernel.accessAllowed ? 'block' : 'none';

    async function convertToInteractive(key) {
      const element = document.querySelector('#df-4d41ac7d-2fef-4b0e-a140-e235f321dab0');
      const dataTable =
        await google.colab.kernel.invokeFunction('convertToInteractive',
                                                 [key], {});
      if (!dataTable) return;

      const docLinkHtml = 'Like what you see? Visit the ' +
        '<a target="_blank" href=https://colab.research.google.com/notebooks/data_table.ipynb>data table notebook</a>'
        + ' to learn more about interactive tables.';
      element.innerHTML = '';
      dataTable['output_type'] = 'display_data';
      await google.colab.output.renderOutput(dataTable, element);
      const docLink = document.createElement('div');
      docLink.innerHTML = docLinkHtml;
      element.appendChild(docLink);
    }
  </script>
</div>
8.Reshaping (변형)
Stack (스택)
1 | tuples = list(zip(*[['bar', 'bar', 'baz', 'baz', |
| A | B | ||
|---|---|---|---|
| first | second | ||
| bar | one | -0.827364 | -1.346867 |
| two | -1.197194 | -0.118960 | |
| baz | one | -1.071918 | 0.825303 |
| two | 0.507340 | -1.517231 |
  <script>
    const buttonEl =
      document.querySelector('#df-5a082081-c6ac-484f-9748-3682bcfb55a3 button.colab-df-convert');
    buttonEl.style.display =
      google.colab.kernel.accessAllowed ? 'block' : 'none';

    async function convertToInteractive(key) {
      const element = document.querySelector('#df-5a082081-c6ac-484f-9748-3682bcfb55a3');
      const dataTable =
        await google.colab.kernel.invokeFunction('convertToInteractive',
                                                 [key], {});
      if (!dataTable) return;

      const docLinkHtml = 'Like what you see? Visit the ' +
        '<a target="_blank" href=https://colab.research.google.com/notebooks/data_table.ipynb>data table notebook</a>'
        + ' to learn more about interactive tables.';
      element.innerHTML = '';
      dataTable['output_type'] = 'display_data';
      await google.colab.output.renderOutput(dataTable, element);
      const docLink = document.createElement('div');
      docLink.innerHTML = docLinkHtml;
      element.appendChild(docLink);
    }
  </script>
</div>
- stack() 메소드는 데이터프레임 열들의 계층을 “압축” 한다.
1 | stacked = df2.stack() |
first  second
bar    one     A   -0.827364
               B   -1.346867
       two     A   -1.197194
               B   -0.118960
baz    one     A   -1.071918
               B    0.825303
       two     A    0.507340
               B   -1.517231
dtype: float64
- “Stack된” 데이터프레임 또는 (MultiIndex를 인덱스로 사용하는) Series인 경우, stack()의 역 연산은 unstack()이며, 기본적으로 마지막 계층을 unstack 한다.
1 | stacked.unstack() |
| A | B | ||
|---|---|---|---|
| first | second | ||
| bar | one | -0.827364 | -1.346867 |
| two | -1.197194 | -0.118960 | |
| baz | one | -1.071918 | 0.825303 |
| two | 0.507340 | -1.517231 |
  <script>
    const buttonEl =
      document.querySelector('#df-55a6a6ce-eb1f-401f-8bcb-8246e05bc0dd button.colab-df-convert');
    buttonEl.style.display =
      google.colab.kernel.accessAllowed ? 'block' : 'none';

    async function convertToInteractive(key) {
      const element = document.querySelector('#df-55a6a6ce-eb1f-401f-8bcb-8246e05bc0dd');
      const dataTable =
        await google.colab.kernel.invokeFunction('convertToInteractive',
                                                 [key], {});
      if (!dataTable) return;

      const docLinkHtml = 'Like what you see? Visit the ' +
        '<a target="_blank" href=https://colab.research.google.com/notebooks/data_table.ipynb>data table notebook</a>'
        + ' to learn more about interactive tables.';
      element.innerHTML = '';
      dataTable['output_type'] = 'display_data';
      await google.colab.output.renderOutput(dataTable, element);
      const docLink = document.createElement('div');
      docLink.innerHTML = docLinkHtml;
      element.appendChild(docLink);
    }
  </script>
</div>
1 | stacked.unstack(1) |
| second | one | two | |
|---|---|---|---|
| first | |||
| bar | A | -0.827364 | -1.197194 |
| B | -1.346867 | -0.118960 | |
| baz | A | -1.071918 | 0.507340 |
| B | 0.825303 | -1.517231 |
  <script>
    const buttonEl =
      document.querySelector('#df-d48353b8-1fdf-416f-b815-fc90f9b22135 button.colab-df-convert');
    buttonEl.style.display =
      google.colab.kernel.accessAllowed ? 'block' : 'none';

    async function convertToInteractive(key) {
      const element = document.querySelector('#df-d48353b8-1fdf-416f-b815-fc90f9b22135');
      const dataTable =
        await google.colab.kernel.invokeFunction('convertToInteractive',
                                                 [key], {});
      if (!dataTable) return;

      const docLinkHtml = 'Like what you see? Visit the ' +
        '<a target="_blank" href=https://colab.research.google.com/notebooks/data_table.ipynb>data table notebook</a>'
        + ' to learn more about interactive tables.';
      element.innerHTML = '';
      dataTable['output_type'] = 'display_data';
      await google.colab.output.renderOutput(dataTable, element);
      const docLink = document.createElement('div');
      docLink.innerHTML = docLinkHtml;
      element.appendChild(docLink);
    }
  </script>
</div>
1 | stacked.unstack(0) |
| first | bar | baz | |
|---|---|---|---|
| second | |||
| one | A | -0.827364 | -1.071918 |
| B | -1.346867 | 0.825303 | |
| two | A | -1.197194 | 0.507340 |
| B | -0.118960 | -1.517231 |
  <script>
    const buttonEl =
      document.querySelector('#df-2305db67-99b3-4d0f-94cd-f423b56a95f6 button.colab-df-convert');
    buttonEl.style.display =
      google.colab.kernel.accessAllowed ? 'block' : 'none';

    async function convertToInteractive(key) {
      const element = document.querySelector('#df-2305db67-99b3-4d0f-94cd-f423b56a95f6');
      const dataTable =
        await google.colab.kernel.invokeFunction('convertToInteractive',
                                                 [key], {});
      if (!dataTable) return;

      const docLinkHtml = 'Like what you see? Visit the ' +
        '<a target="_blank" href=https://colab.research.google.com/notebooks/data_table.ipynb>data table notebook</a>'
        + ' to learn more about interactive tables.';
      element.innerHTML = '';
      dataTable['output_type'] = 'display_data';
      await google.colab.output.renderOutput(dataTable, element);
      const docLink = document.createElement('div');
      docLink.innerHTML = docLinkHtml;
      element.appendChild(docLink);
    }
  </script>
</div>
Pivot Tables (피봇 테이블)
1 | df = pd.DataFrame({'A' : ['one', 'one', 'two', 'three'] * 3, |
| A | B | C | D | E | |
|---|---|---|---|---|---|
| 0 | one | A | foo | -0.548983 | 0.943447 |
| 1 | one | B | foo | -0.400173 | 1.836891 |
| 2 | two | C | foo | 0.995067 | 0.029331 |
| 3 | three | A | bar | -0.693458 | 0.457755 |
| 4 | one | B | bar | 0.786452 | -0.665671 |
| 5 | one | C | bar | -0.686570 | -1.718177 |
| 6 | two | A | foo | 0.338070 | 0.163933 |
| 7 | three | B | foo | 1.793455 | -0.410172 |
| 8 | one | C | foo | -0.271664 | -0.857467 |
| 9 | one | A | bar | 0.979950 | -1.324755 |
| 10 | two | B | bar | -0.689860 | 0.907164 |
| 11 | three | C | bar | -1.210862 | -0.276602 |
  <script>
    const buttonEl =
      document.querySelector('#df-b66bc639-fd5d-4d5c-8180-1ed50d78e959 button.colab-df-convert');
    buttonEl.style.display =
      google.colab.kernel.accessAllowed ? 'block' : 'none';

    async function convertToInteractive(key) {
      const element = document.querySelector('#df-b66bc639-fd5d-4d5c-8180-1ed50d78e959');
      const dataTable =
        await google.colab.kernel.invokeFunction('convertToInteractive',
                                                 [key], {});
      if (!dataTable) return;

      const docLinkHtml = 'Like what you see? Visit the ' +
        '<a target="_blank" href=https://colab.research.google.com/notebooks/data_table.ipynb>data table notebook</a>'
        + ' to learn more about interactive tables.';
      element.innerHTML = '';
      dataTable['output_type'] = 'display_data';
      await google.colab.output.renderOutput(dataTable, element);
      const docLink = document.createElement('div');
      docLink.innerHTML = docLinkHtml;
      element.appendChild(docLink);
    }
  </script>
</div>
- 이 데이터로부터 피봇 테이블을 매우 쉽게 생성 가능하다.
1 | pd.pivot_table(df, values='D', index=['A', 'B'], columns=['C']) |
| C | bar | foo | |
|---|---|---|---|
| A | B | ||
| one | A | 0.979950 | -0.548983 |
| B | 0.786452 | -0.400173 | |
| C | -0.686570 | -0.271664 | |
| three | A | -0.693458 | NaN |
| B | NaN | 1.793455 | |
| C | -1.210862 | NaN | |
| two | A | NaN | 0.338070 |
| B | -0.689860 | NaN | |
| C | NaN | 0.995067 |
  <script>
    const buttonEl =
      document.querySelector('#df-3e058eed-2670-412b-9bdb-87227d4add5d button.colab-df-convert');
    buttonEl.style.display =
      google.colab.kernel.accessAllowed ? 'block' : 'none';

    async function convertToInteractive(key) {
      const element = document.querySelector('#df-3e058eed-2670-412b-9bdb-87227d4add5d');
      const dataTable =
        await google.colab.kernel.invokeFunction('convertToInteractive',
                                                 [key], {});
      if (!dataTable) return;

      const docLinkHtml = 'Like what you see? Visit the ' +
        '<a target="_blank" href=https://colab.research.google.com/notebooks/data_table.ipynb>data table notebook</a>'
        + ' to learn more about interactive tables.';
      element.innerHTML = '';
      dataTable['output_type'] = 'display_data';
      await google.colab.output.renderOutput(dataTable, element);
      const docLink = document.createElement('div');
      docLink.innerHTML = docLinkHtml;
      element.appendChild(docLink);
    }
  </script>
</div>
9.Time Series (시계열)
- Pandas는 자주 일어나는 변환 (예시 : 5분마다 일어나는 데이터에 대한 2차 데이터 변환) 사이에 수행하는 리샘플링 연산을 위한 간단하고, 강력하며, 효율적인 함수를 제공.
- 이는 재무 (금융) 응용에서 매우 일반적이지만 이에 국한되지는 않는다.
1 | rng = pd.date_range('1/1/2012', periods=100, freq='S') |
2012-01-01    23654
Freq: 5T, dtype: int64
- 시간대를 표현
1 | rng = pd.date_range('3/6/2012 00:00', periods=5, freq='D') |
2012-03-06   -0.480140
2012-03-07   -0.904772
2012-03-08    0.386809
2012-03-09    0.873791
2012-03-10    0.478778
Freq: D, dtype: float64
1 | ts_utc = ts.tz_localize('UTC') |
2012-03-06 00:00:00+00:00   -0.480140
2012-03-07 00:00:00+00:00   -0.904772
2012-03-08 00:00:00+00:00    0.386809
2012-03-09 00:00:00+00:00    0.873791
2012-03-10 00:00:00+00:00    0.478778
Freq: D, dtype: float64
- 다른 시간대로 변환한다.
1 | ts_utc.tz_convert('US/Eastern') |
2012-03-05 19:00:00-05:00   -0.480140
2012-03-06 19:00:00-05:00   -0.904772
2012-03-07 19:00:00-05:00    0.386809
2012-03-08 19:00:00-05:00    0.873791
2012-03-09 19:00:00-05:00    0.478778
Freq: D, dtype: float64
- 시간 표현 <–> 기간 표현으로 변환한다.
1 | rng = pd.date_range('1/1/2012', periods=5, freq='M') |
2012-01-31   -0.914418
2012-02-29   -0.077113
2012-03-31   -0.006825
2012-04-30    0.007167
2012-05-31   -0.733946
Freq: M, dtype: float64
1 | ps = ts.to_period() |
2012-01   -0.914418
2012-02   -0.077113
2012-03   -0.006825
2012-04    0.007167
2012-05   -0.733946
Freq: M, dtype: float64
1 | ps.to_timestamp() |
2012-01-01   -0.914418
2012-02-01   -0.077113
2012-03-01   -0.006825
2012-04-01    0.007167
2012-05-01   -0.733946
Freq: MS, dtype: float64
- 기간 <–> 시간 변환은 편리한 산술 기능들을 사용할 수 있도록 만들어준다.
- 다음 예제에서, 11월에 끝나는 연말 결산의 분기별 빈도를 분기말 익월의 월말일 오전 9시로 변환한다.
1 | prng = pd.period_range('1990Q1', '2000Q4', freq='Q-NOV') |
1990-03-01 09:00   -0.685539
1990-06-01 09:00   -1.076153
1990-09-01 09:00    0.737103
1990-12-01 09:00   -1.115201
1991-03-01 09:00    0.680304
Freq: H, dtype: float64
10.Categoricals (범주화)
- Pandas는 데이터프레임 내에 범주형 데이터를 포함할 수 있다.
1 | df = pd.DataFrame({"id":[1,2,3,4,5,6], "raw_grade":['a', 'b', 'b', 'a', 'a', 'e']}) |
- 가공하지 않은 성적을 범주형 데이터로 변환
1 | df["grade"] = df["raw_grade"].astype("category") |
0    a
1    b
2    b
3    a
4    a
5    e
Name: grade, dtype: category
Categories (3, object): ['a', 'b', 'e']
범주에 더 의미 있는 이름을 붙여야 한다. (Series.cat.categories로 할당하는 것이 적합)
1 | df["grade"].cat.set_categories(["very bad", "bad", "medium", "good", "very good"]) |
0    a
1    b
2    b
3    a
4    a
5    e
Name: grade, dtype: category
Categories (3, object): ['a', 'b', 'e']
- 정렬은 사전 순서가 아닌, 해당 범주에서 지정된 순서대로 배열된다.
- 131번에서 very bad, bad, medium, good, very good 의 순서로 기재되어 있기 때문에 정렬 결과도 해당 순서대로 배열.
1 | df.sort_values(by="grade") |
| id | raw_grade | grade | |
|---|---|---|---|
| 0 | 1 | a | a |
| 3 | 4 | a | a |
| 4 | 5 | a | a |
| 1 | 2 | b | b |
| 2 | 3 | b | b |
| 5 | 6 | e | e |
  <script>
    const buttonEl =
      document.querySelector('#df-b7146b32-62f2-46d3-9fd0-73a739ee4d33 button.colab-df-convert');
    buttonEl.style.display =
      google.colab.kernel.accessAllowed ? 'block' : 'none';

    async function convertToInteractive(key) {
      const element = document.querySelector('#df-b7146b32-62f2-46d3-9fd0-73a739ee4d33');
      const dataTable =
        await google.colab.kernel.invokeFunction('convertToInteractive',
                                                 [key], {});
      if (!dataTable) return;

      const docLinkHtml = 'Like what you see? Visit the ' +
        '<a target="_blank" href=https://colab.research.google.com/notebooks/data_table.ipynb>data table notebook</a>'
        + ' to learn more about interactive tables.';
      element.innerHTML = '';
      dataTable['output_type'] = 'display_data';
      await google.colab.output.renderOutput(dataTable, element);
      const docLink = document.createElement('div');
      docLink.innerHTML = docLinkHtml;
      element.appendChild(docLink);
    }
  </script>
</div>
- 범주의 열을 기준으로 그룹화하면 빈 범주도 표시된다.
1 | df.groupby("grade").size() |
grade
a    3
b    2
e    1
dtype: int64
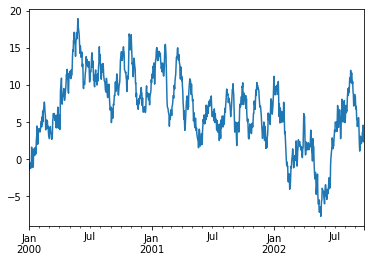
11.Plotting (그래프)
1 | ts = pd.Series(np.random.randn(1000), index=pd.date_range('1/1/2000', periods=1000)) |
<matplotlib.axes._subplots.AxesSubplot at 0x7f177f1ef3d0>
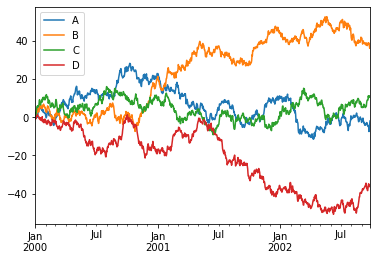
- 데이터프레임에서 plot() 메소드는 라벨이 존재하는 모든 열을 그릴 때 편리하다.
1 | df = pd.DataFrame(np.random.randn(1000, 4), index=ts.index, |
<matplotlib.legend.Legend at 0x7f177ebf3a50>


<Figure size 432x288 with 0 Axes>
12.Getting Data In / Out (데이터 입/출력)
CSV
- csv 파일에 쓴다.
1 | df.to_csv('foo.csv') |
- csv 파일을 읽어낸다.
1 | pd.read_csv('foo.csv') |
| Unnamed: 0 | A | B | C | D | |
|---|---|---|---|---|---|
| 0 | 2000-01-01 | 0.005390 | -0.616651 | 2.261198 | -0.868199 |
| 1 | 2000-01-02 | -0.084304 | -0.247153 | 0.097660 | -0.381440 |
| 2 | 2000-01-03 | 1.540081 | 0.806761 | 0.628394 | -0.810376 |
| 3 | 2000-01-04 | 2.339388 | 0.573873 | 2.907442 | 0.339424 |
| 4 | 2000-01-05 | 0.938390 | 2.164131 | 3.848056 | 0.158632 |
| ... | ... | ... | ... | ... | ... |
| 995 | 2002-09-22 | -4.732994 | 38.365117 | 10.155791 | -34.795312 |
| 996 | 2002-09-23 | -7.505606 | 38.661194 | 10.837375 | -35.956062 |
| 997 | 2002-09-24 | -4.967844 | 37.522602 | 10.977005 | -35.639584 |
| 998 | 2002-09-25 | -3.707181 | 35.950703 | 11.191352 | -36.306747 |
| 999 | 2002-09-26 | -1.984682 | 36.604786 | 10.741370 | -35.995049 |
1000 rows × 5 columns
  <script>
    const buttonEl =
      document.querySelector('#df-f2acd47f-3ad2-400d-b1c5-ff10dfa1d025 button.colab-df-convert');
    buttonEl.style.display =
      google.colab.kernel.accessAllowed ? 'block' : 'none';

    async function convertToInteractive(key) {
      const element = document.querySelector('#df-f2acd47f-3ad2-400d-b1c5-ff10dfa1d025');
      const dataTable =
        await google.colab.kernel.invokeFunction('convertToInteractive',
                                                 [key], {});
      if (!dataTable) return;

      const docLinkHtml = 'Like what you see? Visit the ' +
        '<a target="_blank" href=https://colab.research.google.com/notebooks/data_table.ipynb>data table notebook</a>'
        + ' to learn more about interactive tables.';
      element.innerHTML = '';
      dataTable['output_type'] = 'display_data';
      await google.colab.output.renderOutput(dataTable, element);
      const docLink = document.createElement('div');
      docLink.innerHTML = docLinkHtml;
      element.appendChild(docLink);
    }
  </script>
</div>
HDF5
- HDFStores에 읽고 쓴다.
1 | df.to_hdf('foo.h5','df') |
- HDF5 Store에서 읽어온다.
1 | pd.read_hdf('foo.h5', 'df') |
| A | B | C | D | |
|---|---|---|---|---|
| 2000-01-01 | 0.005390 | -0.616651 | 2.261198 | -0.868199 |
| 2000-01-02 | -0.084304 | -0.247153 | 0.097660 | -0.381440 |
| 2000-01-03 | 1.540081 | 0.806761 | 0.628394 | -0.810376 |
| 2000-01-04 | 2.339388 | 0.573873 | 2.907442 | 0.339424 |
| 2000-01-05 | 0.938390 | 2.164131 | 3.848056 | 0.158632 |
| ... | ... | ... | ... | ... |
| 2002-09-22 | -4.732994 | 38.365117 | 10.155791 | -34.795312 |
| 2002-09-23 | -7.505606 | 38.661194 | 10.837375 | -35.956062 |
| 2002-09-24 | -4.967844 | 37.522602 | 10.977005 | -35.639584 |
| 2002-09-25 | -3.707181 | 35.950703 | 11.191352 | -36.306747 |
| 2002-09-26 | -1.984682 | 36.604786 | 10.741370 | -35.995049 |
1000 rows × 4 columns
  <script>
    const buttonEl =
      document.querySelector('#df-d8254976-8070-4b22-bdc3-11fbbd746968 button.colab-df-convert');
    buttonEl.style.display =
      google.colab.kernel.accessAllowed ? 'block' : 'none';

    async function convertToInteractive(key) {
      const element = document.querySelector('#df-d8254976-8070-4b22-bdc3-11fbbd746968');
      const dataTable =
        await google.colab.kernel.invokeFunction('convertToInteractive',
                                                 [key], {});
      if (!dataTable) return;

      const docLinkHtml = 'Like what you see? Visit the ' +
        '<a target="_blank" href=https://colab.research.google.com/notebooks/data_table.ipynb>data table notebook</a>'
        + ' to learn more about interactive tables.';
      element.innerHTML = '';
      dataTable['output_type'] = 'display_data';
      await google.colab.output.renderOutput(dataTable, element);
      const docLink = document.createElement('div');
      docLink.innerHTML = docLinkHtml;
      element.appendChild(docLink);
    }
  </script>
</div>
Excel
MS Excel에 읽고 쓴다.
엑셀 파일에 쓴다.
1 | df.to_excel('foo.xlsx', sheet_name='Sheet1') |
- 엑셀 파일을 읽어온다.
1 | pd.read_excel('foo.xlsx', 'Sheet1', index_col = None, na_values=['NA']) |
| Unnamed: 0 | A | B | C | D | |
|---|---|---|---|---|---|
| 0 | 2000-01-01 | 0.005390 | -0.616651 | 2.261198 | -0.868199 |
| 1 | 2000-01-02 | -0.084304 | -0.247153 | 0.097660 | -0.381440 |
| 2 | 2000-01-03 | 1.540081 | 0.806761 | 0.628394 | -0.810376 |
| 3 | 2000-01-04 | 2.339388 | 0.573873 | 2.907442 | 0.339424 |
| 4 | 2000-01-05 | 0.938390 | 2.164131 | 3.848056 | 0.158632 |
| ... | ... | ... | ... | ... | ... |
| 995 | 2002-09-22 | -4.732994 | 38.365117 | 10.155791 | -34.795312 |
| 996 | 2002-09-23 | -7.505606 | 38.661194 | 10.837375 | -35.956062 |
| 997 | 2002-09-24 | -4.967844 | 37.522602 | 10.977005 | -35.639584 |
| 998 | 2002-09-25 | -3.707181 | 35.950703 | 11.191352 | -36.306747 |
| 999 | 2002-09-26 | -1.984682 | 36.604786 | 10.741370 | -35.995049 |
1000 rows × 5 columns
  <script>
    const buttonEl =
      document.querySelector('#df-0adace20-cbb2-4908-846b-7f1dd49ea7cb button.colab-df-convert');
    buttonEl.style.display =
      google.colab.kernel.accessAllowed ? 'block' : 'none';

    async function convertToInteractive(key) {
      const element = document.querySelector('#df-0adace20-cbb2-4908-846b-7f1dd49ea7cb');
      const dataTable =
        await google.colab.kernel.invokeFunction('convertToInteractive',
                                                 [key], {});
      if (!dataTable) return;

      const docLinkHtml = 'Like what you see? Visit the ' +
        '<a target="_blank" href=https://colab.research.google.com/notebooks/data_table.ipynb>data table notebook</a>'
        + ' to learn more about interactive tables.';
      element.innerHTML = '';
      dataTable['output_type'] = 'display_data';
      await google.colab.output.renderOutput(dataTable, element);
      const docLink = document.createElement('div');
      docLink.innerHTML = docLinkHtml;
      element.appendChild(docLink);
    }
  </script>
</div>
13.Gotchas (잡았다!)
- 연산 수행 시 다음과 같은 예외 상황(Error)을 볼 수도 있다.
1 | if pd.Series([False, True, False]): |
---------------------------------------------------------------------------

ValueError                                Traceback (most recent call last)

<ipython-input-129-5c782b38cd2f> in <module>()
----> 1 if pd.Series([False, True, False]):
      2     print("I was true")


/usr/local/lib/python3.7/dist-packages/pandas/core/generic.py in __nonzero__(self)
   1536     def __nonzero__(self):
   1537         raise ValueError(
-> 1538             f"The truth value of a {type(self).__name__} is ambiguous. "
   1539             "Use a.empty, a.bool(), a.item(), a.any() or a.all()."
   1540         )


ValueError: The truth value of a Series is ambiguous. Use a.empty, a.bool(), a.item(), a.any() or a.all().
- 이런 경우에는 any(), all(), empty 등을 사용해서 무엇을 원하는지를 선택 (반영)해주어야 한다.
1 | if pd.Series([False, True, False])is not None: |
I was not None
End of document
pandas_10minutes
You need to set
install_url to use ShareThis. Please set it in _config.yml.Like this article? Support the author with
Afdian.netAlipay Buy me a coffeePatreon
You forgot to set the
Wechatbusiness or currency_code for Paypal. Please set it in _config.yml.Comments
You forgot to set the
shortname for Disqus. Please set it in _config.yml.