chapter_8_1_2
08-2. 합성곱 신경망을 이용한 이미지 분류
패션 MNIST 데이터 불러오기
- 데이터 스케일을 0 ~ 255 사이 0 ~ 1 로 표준화
- 훈련 데이터 / 검증 데이터 분류
- 완전 연결 신경망 (Fully Connected Layer)
–> 2차원 배열 -> 1차원 배열 (최종 분류값 도출)
–> 완전 연결 신경망과 달리, 합성곱에서는 2차원 이미지를 그대로 사용한다.
1 | from tensorflow import keras |
Downloading data from https://storage.googleapis.com/tensorflow/tf-keras-datasets/train-labels-idx1-ubyte.gz
32768/29515 [=================================] - 0s 0us/step
40960/29515 [=========================================] - 0s 0us/step
Downloading data from https://storage.googleapis.com/tensorflow/tf-keras-datasets/train-images-idx3-ubyte.gz
26427392/26421880 [==============================] - 0s 0us/step
26435584/26421880 [==============================] - 0s 0us/step
Downloading data from https://storage.googleapis.com/tensorflow/tf-keras-datasets/t10k-labels-idx1-ubyte.gz
16384/5148 [===============================================================================================] - 0s 0us/step
Downloading data from https://storage.googleapis.com/tensorflow/tf-keras-datasets/t10k-images-idx3-ubyte.gz
4423680/4422102 [==============================] - 0s 0us/step
4431872/4422102 [==============================] - 0s 0us/step
합성곱 신경망 만들기
- 446p
- 437p 그림을 코드로 구현하는 내용
1 | model = keras.Sequential() |
Model: "sequential"
_________________________________________________________________
 Layer (type)                /images/chapter_8_1_2/output Shape              Param #
=================================================================
 conv2d (Conv2D)             (None, 28, 28, 32)        320

 max_pooling2d (MaxPooling2D  (None, 14, 14, 32)       0
 )

 conv2d_1 (Conv2D)           (None, 14, 14, 64)        18496

 max_pooling2d_1 (MaxPooling  (None, 7, 7, 64)         0
 2D)

 flatten (Flatten)           (None, 3136)              0

 dense (Dense)               (None, 100)               313700

 dropout (Dropout)           (None, 100)               0

 dense_1 (Dense)             (None, 10)                1010

=================================================================
Total params: 333,526
Trainable params: 333,526
Non-trainable params: 0
_________________________________________________________________
- 필터의 개수에 따라 특성 맵의 크기는
- 첫 번째 합성곱 층을 통과하면서 특성 맵의 크기가 32가 된다.
- 두 번째 합성곱에서 특성 맵의 크기가 64로 늘어난다.
- 반면 특성 맵의 가로세로 크기는
- 첫 번째 풀링 층에서 절반으로 줄어든다.
- 두 번째 풀링층에서 다시 절반으로 더 줄어든다.
- Flatten 클래스에서 (7,7,64) 크기의 특성 맵을 1차원 배열로 펼친다.
- (7,7,64) -> (3136,)
모델 파라미터 개수 계산
첫 번째 합성곱 층
- 32개 필터, 커널 크기(3,3), 깊이1, 필터마다 하나의 절편 -> 3x3x1x32 + 32 = 320개
두 번째 합성곱 층
- 64개 필터, 커널 크기(3,3), 깊이32, 필터마다 하나의 절편 -> 3x3x32x64 + 64 = 18,496개
Flatten 즉, 은닉층
- (3136,) 개의 1차원 배열, 100개의 뉴런 -> 3136x100 + 100 = 313,700개
필요한 것을 찾아서 가져다 사용할 수 있다.
층의 구성을 그림으로 표현해 본다.
keras.uitls 패키지의 plot_model() 함수 사용
1 | keras.utils.plot_model(model) |

박스 안에서
- 왼쪽 : 층의 이름
- 오른쪽 : 클래스
inputLayer 클래스
- 케라스가 자동으로 추가해주는 입력층의 역할.
- Conv2D 클래스의 input_shape 매개변수를 사용.
층의 구성을 그림으로 표현해 본다.
keras.uitls 패키지의 plot_model() 함수 사용
show_shapes 매개변수를 True로 설정하면 그림에 입력과 출력의 크기를 표시한다.
1 | keras.utils.plot_model(model, show_shapes = True) |

- 지금까지 한 것은 모델 정의
- 모델 컴파일 후, 훈련
- 7장 내용
- Adam 옵티마이저를 사용
- 조기 종료 기법을 구현 : ModelCheckpoint 콜백과 EarlyStopping 콜백을 함께 사용한다.
1 | import tensorflow as tf |
Epoch 1/10
1500/1500 [==============================] - 59s 39ms/step - loss: 0.4968 - accuracy: 0.8231 - val_loss: 0.3245 - val_accuracy: 0.8799
Epoch 2/10
1500/1500 [==============================] - 55s 37ms/step - loss: 0.3304 - accuracy: 0.8809 - val_loss: 0.2726 - val_accuracy: 0.8967
Epoch 3/10
1500/1500 [==============================] - 55s 37ms/step - loss: 0.2833 - accuracy: 0.8987 - val_loss: 0.2461 - val_accuracy: 0.9072
Epoch 4/10
1500/1500 [==============================] - 55s 37ms/step - loss: 0.2534 - accuracy: 0.9069 - val_loss: 0.2360 - val_accuracy: 0.9119
Epoch 5/10
1500/1500 [==============================] - 55s 37ms/step - loss: 0.2311 - accuracy: 0.9165 - val_loss: 0.2258 - val_accuracy: 0.9170
Epoch 6/10
1500/1500 [==============================] - 55s 37ms/step - loss: 0.2104 - accuracy: 0.9224 - val_loss: 0.2346 - val_accuracy: 0.9157
Epoch 7/10
1500/1500 [==============================] - 55s 37ms/step - loss: 0.1916 - accuracy: 0.9275 - val_loss: 0.2132 - val_accuracy: 0.9234
Epoch 8/10
1500/1500 [==============================] - 55s 37ms/step - loss: 0.1757 - accuracy: 0.9343 - val_loss: 0.2152 - val_accuracy: 0.9220
Epoch 9/10
1500/1500 [==============================] - 56s 37ms/step - loss: 0.1619 - accuracy: 0.9393 - val_loss: 0.2172 - val_accuracy: 0.9247
- 훈련 세트의 정확도가 이전에 비해 증가했다.
- 손실 그래프를 그린다.
- 조기 종료가 잘 이루어졌는지 확인하자.
1 | import matplotlib.pyplot as plt |

- 그래프를 기반으로 9번째 에포크를 최적으로 생각할 수 잇다.
- 세트에 대한 성능을 평가해본다.
1 | model.evaluate(val_scaled, val_target) |
375/375 [==============================] - 5s 14ms/step - loss: 0.2132 - accuracy: 0.9234


[0.21322399377822876, 0.9234166741371155]
- 좌측 파일 선택 -> best-cnn-model.h5 다운로드
08-3. 합성곱 신경망 시각화
- 교재 465p
- 사전 학습 = 이전에 만든 모델이 어떤 가중치를 학습했는지 확인하기 위해 체크포인트 파일을 읽는다.
- model.layers
- 케라스 모델에 추가한 층을 출력한다.
1 | from tensorflow import keras |
[<keras.layers.convolutional.Conv2D at 0x7fe1487e19d0>,
 <keras.layers.pooling.MaxPooling2D at 0x7fe1d0495b50>,
 <keras.layers.convolutional.Conv2D at 0x7fe148c92590>,
 <keras.layers.pooling.MaxPooling2D at 0x7fe1487fa9d0>,
 <keras.layers.core.flatten.Flatten at 0x7fe1446bad10>,
 <keras.layers.core.dense.Dense at 0x7fe1446ba210>,
 <keras.layers.core.dropout.Dropout at 0x7fe14465cf50>,
 <keras.layers.core.dense.Dense at 0x7fe14465dcd0>]
- 합성곱 층의 가중치를 확인 가능
- 우선 첫 번째 합성곱 층의 가중치를 조사한다.
1 | conv = model.layers[0] |
(3, 3, 1, 32) (32,)
1 | conv_weights = conv.weights[0].numpy() |
-0.038952995 0.26509935
- 이 가중치가 어떤 분표를 가졌는지 보기 쉽게 히스토그램으로 그린다.
1 | plt.hist(conv_weights.reshape(-1, 1)) |

- 이 가중치가 어떤 의미인지 시각화 해보자.
- 468p
- 32개의 커널을 16개씩 2줄로 출력한다.
1 | ig, axs = plt.subplots(2, 16, figsize=(15,2)) |

- 색이 밝은지 어두운지를 통해 가중치를 판단할 수 있다.
이번에는 훈련하지 않은 빈 합성곱 신경망을 만든다.
- 먼저 Conv2D 층을 하나 추가한다.
1 | no_training_model = keras.Sequential() |
- 첫 번째 Conv2D층의 가중치를 no_training_conv 변수에 저장한다.
1 | no_training_conv = no_training_model.layers[0] |
(3, 3, 1, 32)
- 가중치의 평균과 표준편차를 확인한다.
1 | no_training_weights = no_training_conv.weights[0].numpy() |
0.011464282 0.08503365
- 이 가중치 배열을 히스토그램으로 표현한다.
1 | plt.hist(no_training_weights.reshape(-1, 1)) |

- 그래프가 이전과 확실히 다르다.
- 이 가중치 값을 맷플롯립의 imshow() 함수를 사용해 이전처럼 그림으로 출력한다.
1 | ig, axs = plt.subplots(2, 16, figsize=(15,2)) |

- 전체적으로 가중치가 밋밋하게 초기화되었다.
- 이 그림을 훈련이 끝난 이전 가중치와 비교해보자.
- 합성곱 신경망이 패현MNIST 데이터셋의 부류 정확도를 높이기 위해 유용한 패턴을 학습했다는 사실을 눈치챌 수 있다.
함수형 API
- 474p
- 특성 맵 시각화
- 케라스로 패현 MNIST 데이터셋을 읽은 후 훈련 세트에 있는 첫 번째 샘플을 그려본다.
1 | print(model.input) |
KerasTensor(type_spec=TensorSpec(shape=(None, 28, 28, 1), dtype=tf.float32, name='conv2d_input'), name='conv2d_input', description="created by layer 'conv2d_input'")

- 앵클 부트다.
- 이 샘플을 conv_acti 모델에 주입하여 Conv2D 층이 만드는 특성 맵을 출력한다.
- 08-2장에서 했던 것처럼 전처리를 진행한다.
- feature_maps의 크기를 확인한다.
1 | inputs = train_input[0:1].reshape(-1, 28, 28, 1)/255.0 |
(1, 28, 28, 32)
- same 패딩과 32개의 필터를 사용한 합성곱 층의 출력이므로 (28,28,32)이다.
- 샘플을 하나 입력했기에 1이다.
- 앞에서와 같이 맷플롯립의 imshow함수로 특성 맵을 그린다.
- 32개의 특성 맵을 4개의 행으로 나누어 그린다.
1 | fig, axs = plt.subplots(4, 8, figsize=(15,8)) |

- 두 번째 합성곱 층이 많든 특성 맵도 같은 방식으로 확인할 수 있다.
- 먼저 model 객체의 입력과 두 번째 합성곱 층인 model.layers[2]의 출력을 연결한 conv2_acti 모델을 만든다.
- 그 다음 첫 샘플을 conv2_acti 모델의 predict() 메서드에 전달한다.
- 첫 번째 풀링 층에서 가로세로 크기가 줄반으로 줄고, 두 번째 합성곱 층의 필터 개수는 64개이므로 (14,14,64) 가 된다.
- 64개의 특성 맵을 8개씩 나누어 imshow()함수로 그린다.
1 | conv2_acti = keras.Model(model.input, model.layers[2]./images/chapter_8_1_2/output) |
(1, 14, 14, 64)
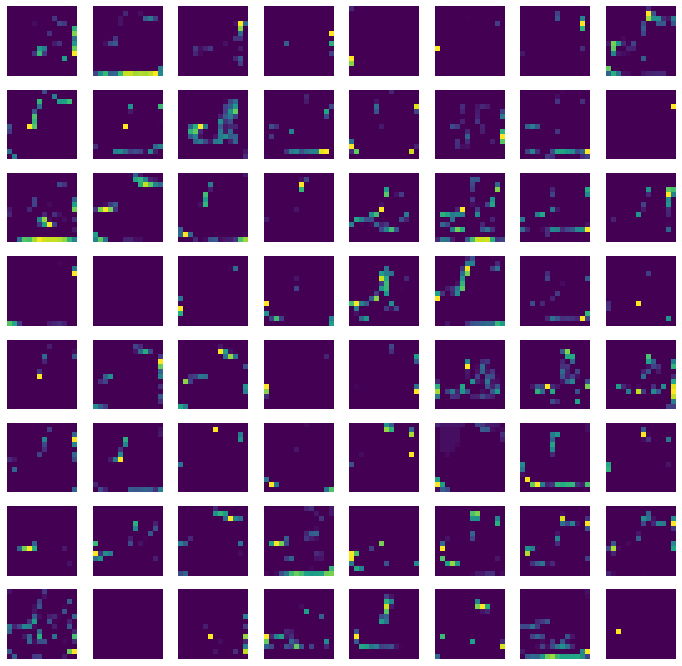
이번 특성 맵은 시각적으로 이해하기 어렵다.
두 번째 합성곱 층의 필터 크기는 (3,3,32)인데 (14,14,32)인 특성 맵에서 어떤 부위를 감지하는지 직관적으로 이해하기 어렵다.
- 478p 그림 참고
이런 현상은 합성곱 층을 많이 쌓을수록 심해진다.
Reference : 혼자 공부하는 머신러닝 + 딥러닝


